
Page 55 - PROOF_ENG
P. 55
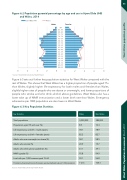
Figure 6:2 Population pyramid percentage by age and sex in Hywel Dda UHB and Wales, 2014
HywelDda UHB
Wales
Males
Females
53
90+ 85 -89 80 -84 75 -79 70 -74 65 -69 60 -64 55 -59 50 -54 45 -49 40 -44 35 -39 30 -34 25 -29 20 -24 15 -19 10 -14 05 -09 00 -04
8642002468
Source: Hywel Dda University Health Board
Figure 6.3 sets out further key population statistics for West Wales compared with the rest of Wales. This shows that West Wales has a higher proportion of people aged 75+ than Wales; slightly higher life expectancy for both males and females than Wales; slightly higher rates of people who are obese or overweight, and lower proportions of people who smoke and who drink alcohol above guidelines. West Wales also has a lower take up of MMR immunization and a lower birth rate than Wales. Emergency admissions per 1000 population are also lower in West Wales.
Figure 6:3 Key Population Statistics
Key Statistics
Total population
Population aged 75 and over (%)
Life expectancy at birth – males (years)
Life expectancy at birth – females (years)
Adults who are overweight or obese (%)
Adults who smoke (%)
Adults who drink above guidelines (%)
MMR uptake (%)
Live birth per 1,000 women aged 15-44
Emergency hospital admissions (European age standardised rate per 1,000 population)
Wales West Wales
3,092,000 384,000 8.9 10.3 78.1 78.9 82.2 82.7 58.1 58.5 20.9 19.7 41.1 39.1 95.8 94.9 59.1 56.8 112.4 105.3
Source: Hywel Dda University Health Board
West Wales Population Assessment March 2017 West Wales population profile
