
Page 56 - PROOF_ENG
P. 56
54
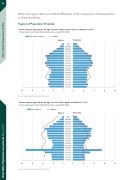
Within the region there are notable differences in the composition of the population as illustrated below:
Figure 6:4 Population Pyramids
Percentage of population by age and sex, Carmarthenshire and Wales, 2015
Producedby PublicHealth WalesObservatory, using MYE (ONS)
Carm arthenshire
Wales
Males
Fem ales
90+ 85-89 80-84 75-79 70-74 65-69 60-64 55-59 50-54 45-49 40-44 35-39 30-34 25-29 20-24 15-19 10-14 05-09 00-04
8642002468
Source: Hywel Dda University Health Board
Percentage of population by age and sex, Ceredigion and Wales, 2015
Producedby PublicHealth WalesObservatory, using MYE (ONS)
Ceredigion
Wales
Males
Fem ales
90+ 85-89 80-84 75-79 70-74 65-69 60-64 55-59 50-54 45-49 40-44 35-39 30-34 25-29 20-24 15-19 10-14 05-09 00-04
8642002468
Source: Hywel Dda University Health Board
West Wales Population Assessment March 2017 West Wales population profile
