
Page 435 - Caracterizacion del sector agrario 2024
P. 435
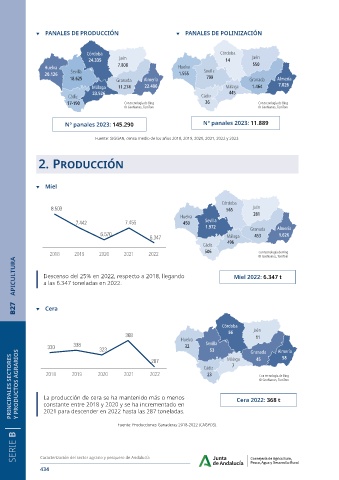
PANALES DE PRODUCCIÓN                            PANALES DE POLINIZACIÓN


                                Córdoba                                       Córdoba
                                           Jaén                                           Jaén
                                24.335                                          14
                                          7.808                                           550
                 Huelva                                         Huelv
                          Sevilla
                 20.126                                         1.555
                          18.625          Granada   Almería               799            Granada  Almería
                                 Málaga    11.274   22.406                                1.464    7.026
                                 23.526                                          445
                         Cádiz                                          Cádi
                         17-190              Con tecnología de Bing      36                 Con tecnología de Bing
                                             © GeoNames, TomTom                             © GeoNames, TomTom


                        Nº panales 2023: 145.290                        Nº panales 2023: 11.889

                                   Fuente: SIGGAN, censo medio de los años 2018, 2019, 2020, 2021, 2022 y 2023.


               2. Producción


                 Miel


                                                                               Córdoba
                   8.503                                                         565      Jaén
                                                                                          281
                                                                Huelva
                            7.442            7.455               450     Sevilla
                                                                         1.972           Granada  Almería
                                    6.570                                                          1.626
                                                      6.347                      Málaga   453
                                                                                 496
                                                                        Cádiz
                   2018    2019     2020     2021    2022                506                Con tecnología de Bing
                                                                                            © GeoNames, TomTom
      B27    APICULTURA  Descenso del 25% en 2022, respecto a 2018, llegando       Miel 2022: 6.347 t


                a las 6.347 toneladas en 2022.


                 Cera


                                                                               Córdoba
                                                                                          Jaén
                                             368                                 56
                                                                 Huelva                    11
                  330      338      323               287         32     Sevilla  Málaga  Granada  Almería
                                                                           53
     PRINCIPALES SECTORES  Y PRODUCTOS AGRARIOS  La producción de cera se ha mantenido más o menos   Cádiz  Cera 2022: 368 t
                                                                                                    58
                                                                                           45
                                                                                   7
                          2019
                                             2021
                 2018
                                                      2022
                                   2020
                                                                          23
                                                                                            Con tecnología de Bing
                                                                                            © GeoNames, TomTom
                constante entre 2018 y 2020 y se ha incrementado en
                2021 para descender en 2022 hasta las 287 toneladas.
                                          Fuente: Producciones Ganaderas 2018-2022 (CAGPDS).

      SERIE B  Caracterización del sector agrario y pesquero de Andalucía


               434