
Page 18 - NOT FOR SELL SIBUSISIWEFXupdate_Neat
P. 18
In general RSI is used in Five Different Ways:
Top and Bottoms – Overbought and Oversold conditions are usually signalled at 30 and 70.
Divergences – When a pair makes new high (lows) but RSI does not, this usually indicates that a
reversal in price is coming.
Support and Resistance – RSI may show levels of support and resistance, sometimes more clearly
than the price chart itself.
Chart Formations – Patterns such as double tops and head and shoulder may be more visible on RSI
rather than on the price charts.
Failure Swings – When RSI breaks out (surpasses previous highs or lows), this may indicate that a
breakout in price is coming.
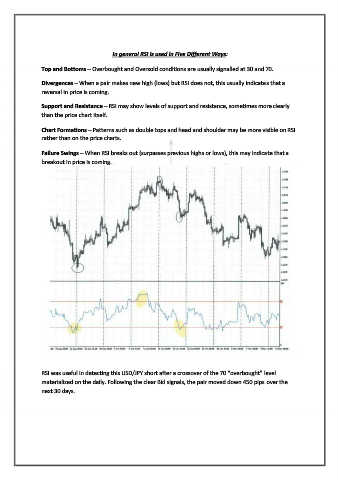
RSI was useful in detecting this USD/JPY short after a crossover of the 70 “overbought” level
materialized on the daily. Following the clear Bid signals, the pair moved down 450 pips over the
next 30 days.