
Page 19 - Physics Coursebook 2015 (A level)
P. 19
Chapter 1: Kinematics – describing motion
The straight line shows that the s object’s velocity is constant.
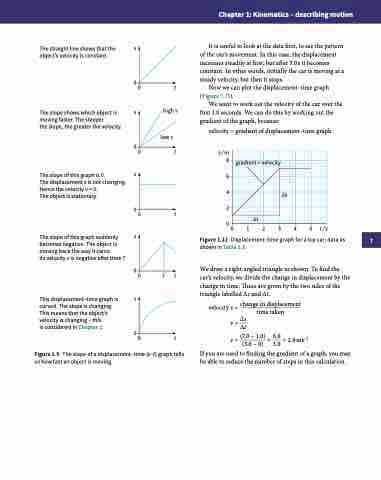
It is useful to look at the data first, to see the pattern of the car’s movement. In this case, the displacement increases steadily at first, but after 3.0 s it becomes constant. In other words, initially the car is moving at a steady velocity, but then it stops.
Now we can plot the displacement–time graph (Figure 1.11).
We want to work out the velocity of the car over the first 3.0 seconds. We can do this by working out the gradient of the graph, because:
velocity = gradient of displacement−time graph
The straight line shows that the s object’s velocity is constant.
The straight line shows that the s
object’s velocity is constant. The straight line shows that the
object’s velocity is constant.
The straight line shows that the s
object’s velocity is constant. The slope shows which object is
0 0
high v t
moving faster. The steeper
The slope shows which object is
0 0 0
high v t
the slope, the greater the velocity.
moving faster. The steeper
high v low v t
The slope shows which object is s
0 The slope shows which object is s
s
00
t t
0s s
the slope, the greater the velocity. moving faster. The steeper
s0 0 s0 0 s0
0 The slope shows which object is s
0 0
high v low v
the slope, the greater the velocity. moving faster. The steeper
0
hightv
the slope, the greater the velocity. moving faster. The steeper
The slope of this graph is 0.
low v low v low v
t t t
s/m 8
6 4 2 0
the slope, the greater the velocity. The displacement s is not changing. The slope of this graph is 0.
gradient = velocity
Hence the velocity v = 0.
The displacement s is not changing.
The solbojpeectoifstshtiastgioranparhyi.s 0.
Hence the velocity v = 0. 0
The displacement s is not changing.
s0t
The oslbojpeectoifstshtiastgiornaparhyi.s 0.
Hence the velocity v = 0. 0
The displacement s is not changing. 0 t
∆s
The oslbojpeectoifstshtiastgiornaparhyi.s 0. s
0 The oslbojpeectoifstshtiastgiornaparhys. uddenly s
Hence the velocity v = 0.
The displacement s is not changing.
0 t
Hence the velocity v = 0. 0
becomes negative. The object is 0 t The slope of this graph suddenly s
The object is stationary.
moving back the way it came.
becomes negative. The object is
∆t
0 1 2 3 4 5 t/s
TIthseveslocpietyovf tishinsegratpivhesauftdedretnimlye T. moving back the way it came. 0 becomes negative. The object is 0 ITthseveslocpietyovf tishinsegratpivhesauftdedretnimlye T. s
moving back the way it came.
becomes negative. The object is ITthseveslocpietyovf tishinsegratpivhesauftdedretnimlye T. moving back the way it came.
becomes negative. The object is ITthsivsedloiscpitlaycveims nenegt–atiimveagftraepr htimise T. 0 moving back the way it came.
curved. The slope is changing.
This displacement–time graph is
Its velocity v is negative after time T.
0 s0
This means that the object’s
curved. The slope is changing.
is
is s
T t T t
t t t t t
Tvehlioscditisypislacheamnegnint–gt–imtheigsraph
This means that the object’s
0
cisucrovendsi.dTehredslionpCehiaspcthearn2g.ing. vTehlioscditisypislacheamnegnint–gt–imtheigsraph This means that the object’s icsucrovendsi.dTehredslionpCehiaspcthearn2g.ing. Tvehlioscditisypislacheamnegnint–gt–imtheigsraph This means that the object’s cisucrovendsi.dTehredslionpCehiaspcthearn2g.ing. velocity is changing – this This means that the object’s is considered in Chapter 2. velocity is changing – this
is considered in Chapter 2.
0
0
0 0 0 0 0
is s 0
0 0 0
change in displacement
time taken
Δt
v = (7.0 − 1.0) = 6.0 = 2.0 ms−1
(3.0 − 0) 3.0
If you are used to finding the gradient of a graph, you may
be able to reduce the number of steps in this calculation.
0
0 t
s
t 0 T t
0 s0Tt
0
Figure 1.11 Displacement–time graph for a toy car; data as shown in Table 1.3.
We draw a right-angled triangle as shown. To find the car’s velocity, we divide the change in displacement by the change in time. These are given by the two sides of the triangle labelled Δs and Δt.
s
0
T t
s
velocity v = v=
Δs
Figure 1.9 The slope of a displacement–time (s–t) graph tells us how fast an object is moving.
7
