
Page 20 - Physics Coursebook 2015 (A level)
P. 20
Cambridge International AS Level Physics
Displacement / m
0
85
170
255
340
Time/s
0
1.0
2.0
3.0
4.0
Time/h
Distance / km
0
0
1
23
2
46
3
69
4
84
8
ridge valley
cairn
START
river bridge
1 2 3 4 5 km
FINISH
QUESTIONS
10
The displacement–time sketch graph in Figure 1.10 represents the journey of a bus. What does the graph tell you about the journey?
s
00
Figure 1.10 For Question 10.
11
12
Sketch a displacement–time graph to show your motion for the following event. You are walking at a constant speed across a field after jumping off a gate. Suddenly you see a bull and stop. Your friend says there’s no danger, so you walk on at a reduced constant speed. The bull bellows, and you run back to the gate. Explain how each section of the walk relates to a section of your graph.
Table 1.4 shows the displacement of a racing car at different times as it travels along a straight track during a speed trial.
a Determine the car’s velocity.
b Draw a displacement–time graph and use it to
find the car’s velocity.
t
Table 1.4 Displacement (s) and time (t) data for Question 12.
13 An old car travels due south. The distance it travels at hourly intervals is shown in Table 1.5.
a Draw a distance–time graph to represent the car’s journey.
b From the graph, deduce the car’s speed in km h−1 during the first three hours of the journey.
c What is the car’s average speed in km h−1 during the whole journey?
Table 1.5 Data for Question 13.
Combining displacements
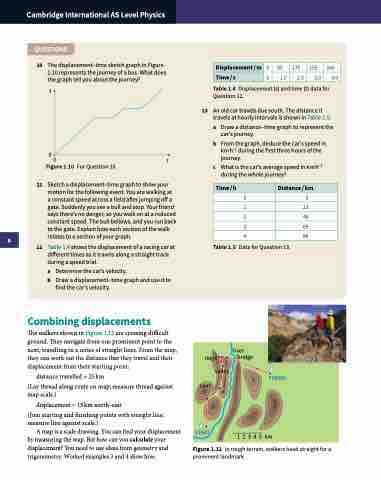
The walkers shown in Figure 1.12 are crossing difficult ground. They navigate from one prominent point to the next, travelling in a series of straight lines. From the map, they can work out the distance that they travel and their displacement from their starting point:
distance travelled = 25 km
(Lay thread along route on map; measure thread against map scale.)
displacement = 15 km north-east
(Join starting and finishing points with straight line; measure line against scale.)
A map is a scale drawing. You can find your displacement by measuring the map. But how can you calculate your displacement? You need to use ideas from geometry and trigonometry. Worked examples 3 and 4 show how.
Figure 1.12 In rough terrain, walkers head straight for a prominent landmark.
