
Page 254 - Physics Coursebook 2015 (A level)
P. 254
Cambridge International AS Level Physics
We will first consider the precision of a measurement. The level of precision is high if you make several measurements of a quantity and they are all very similar. A precise measurement, when repeated, will be the same, or nearly so. However, if your measurements are spread widely around the average, they are less precise. This
can arise because of practical difficulties in making the measurements.
Precision is reflected in how the results are recorded.
If a distance is quoted as ‘15 m’ then it implies that it was only measured to the nearest metre, whereas if it is quoted as ‘15.0 m’ then it suggests that it was measured to the nearest 0.1 m.
Take care not to confuse precision with accuracy.
A measurement is described as ‘accurate’ if the value obtained is close to the true value. Even if a measurement is precise, and always produces the same result, it may not be accurate because every reading may have the
same error. For example, you can make very precise measurements of the diameter of a wire using a micrometer screw gauge to the nearest 0.01 mm, but every reading may be inaccurate if the gauge has a zero error.
uncertainty of 0.5 mm, giving a total uncertainty of 1 mm. The uncertainty will depend not only on the precision
of the calibrations on the instrument you are using, but also on your ability to observe and on errors introduced by less than perfect equipment or poor technique in taking the observations. Here are some examples of where uncertainties might arise:
■■ Systematic error – A spring on a force meter might,
over time, become weaker so that the force meter reads consistently high. Similarly the magnet in an ammeter might, over the years, become weaker and the needle may not move quite as far round the scale as might be expected. Parallax errors, described earlier, may be another example of a systematic error if one always looks from the same angle, and not directly from above, when taking a measurement. In principle, systematic errors can be corrected for by recalibrating the instrument or by correcting the technique being used.
■■ Zero error – The zero on a ruler might not be at the very beginning of the ruler. This will introduce a fixed error into any reading unless it is allowed for. This is a type of systematic error.
■■ Random errors – When a judgement has to be made by the observer, a measurement will sometimes be above and sometimes below the true value. Random errors can be reduced by making multiple measurements and averaging the results.
Good equipment and good technique will reduce the uncertainties introduced, but difficulties and judgements in making observations will limit the precision of your measurements. Here are two examples of how difficulties in observation will determine the uncertainty in your measurement.
Example 1: Using a stopwatch
Tambo has a digital stopwatch which measures to the nearest one-hundredth of a second. He is timing Nana in a 100 metre race (Figure P1.6). He shows her the stopwatch, which reads 11.87 s. She records in her notebook the time 11.9 s. She explains to Tambo that he cannot possibly
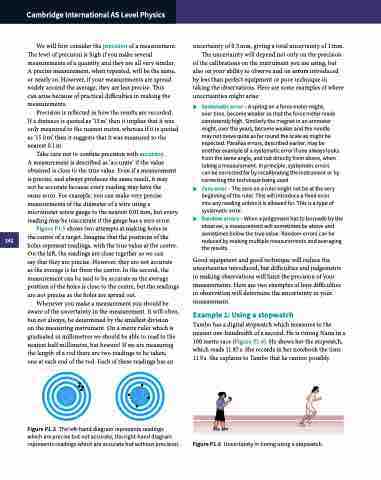
Figure P1.5 shows two attempts at making holes in the centre of a target. Imagine that the positions of the
242 holes represent readings, with the true value at the centre. On the left, the readings are close together so we can
say that they are precise. However, they are not accurate as the average is far from the centre. In the second, the measurement can be said to be accurate as the average position of the holes is close to the centre, but the readings are not precise as the holes are spread out.
Whenever you make a measurement you should be aware of the uncertainty in the measurement. It will often, but not always, be determined by the smallest division
on the measuring instrument. On a metre ruler which is graduated in millimetres we should be able to read to the nearest half millimetre, but beware! If we are measuring the length of a rod there are two readings to be taken,
one at each end of the rod. Each of these readings has an
Figure P1.5 The left-hand diagram represents readings which are precise but not accurate; the right-hand diagram represents readings which are accurate but without precision.
Figure P1.6 Uncertainty in timing using a stopwatch.
