
Page 255 - Physics Coursebook 2015 (A level)
P. 255
P1: Practical skills at AS level
measure to the nearest one-hundredth of a second as he has to judge both when the starting pistol was fired and the exact moment at which she crossed the finishing line. To do this to any closer than the nearest one-tenth of a second is impossible. In addition, sometimes he will press the button too early and sometimes too late.
Example 2: Measuring displacement of a pendulum
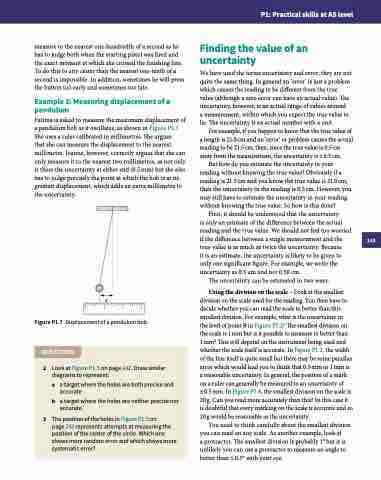
Fatima is asked to measure the maximum displacement of a pendulum bob as it oscillates, as shown in Figure P1.7. She uses a ruler calibrated in millimetres. She argues
that she can measure the displacement to the nearest millimetre. Joanne, however, correctly argues that she can only measure it to the nearest two millimetres, as not only is there the uncertainty at either end (0.5 mm) but she also has to judge precisely the point at which the bob is at its greatest displacement, which adds an extra millimetre to the uncertainty.
Finding the value of an uncertainty
We have used the terms uncertainty and error; they are not quite the same thing. In general an ‘error’ is just a problem which causes the reading to be different from the true value (although a zero error can have an actual value). The uncertainty, however, is an actual range of values around
a measurement, within which you expect the true value to lie. The uncertainty is an actual number with a unit.
For example, if you happen to know that the true value of a length is 21.0 cm and an ‘error’ or problem causes the actual reading to be 21.5 cm, then, since the true value is 0.5 cm away from the measurement, the uncertainty is ± 0.5 cm.
But how do you estimate the uncertainty in your reading without knowing the true value? Obviously if a reading is 21.5 cm and you know the true value is 21.0 cm, then the uncertainty in the reading is 0.5 cm. However, you may still have to estimate the uncertainty in your reading without knowing the true value. So how is this done?
First, it should be understood that the uncertainty
is only an estimate of the difference between the actual reading and the true value. We should not feel too worried if the difference between a single measurement and the true value is as much as twice the uncertainty. Because
it is an estimate, the uncertainty is likely to be given to only one significant figure. For example, we write the uncertainty as 0.5 cm and not 0.50 cm.
The uncertainty can be estimated in two ways.
Using the division on the scale – Look at the smallest division on the scale used for the reading. You then have to decide whether you can read the scale to better than this smallest division. For example, what is the uncertainty in
the level of point B in Figure P1.2? The smallest division on the scale is 1 mm but is it possible to measure to better than
1 mm? This will depend on the instrument being used and whether the scale itself is accurate. In Figure P1.2, the width of the line itself is quite small but there may be some parallax error which would lead you to think that 0.5 mm or 1 mm is a reasonable uncertainty. In general, the position of a mark on a ruler can generally be measured to an uncertainty of
± 0.5 mm. In Figure P1.8, the smallest division on the scale is 20 g. Can you read more accurately than this? In this case it is doubtful that every marking on the scale is accurate and so 20 g would be reasonable as the uncertainty.
You need to think carefully about the smallest division you can read on any scale. As another example, look at
a protractor. The smallest division is probably 1° but it is unlikely you can use a protractor to measure an angle to better than ± 0.5° with your eye.
x
Figure P1.7 Displacement of a pendulum bob. QUESTIONS
2 Look at Figure P1.5 on page 242. Draw similar diagrams to represent:
a a target where the holes are both precise and accurate
b a target where the holes are neither precise nor accurate.
3 The position of the holes in Figure P1.5 on
page 242 represents attempts at measuring the position of the centre of the circle. Which one shows more random error and which shows more systematic error?
243
