
Page 258 - Physics Coursebook 2015 (A level)
P. 258
Cambridge International AS Level Physics
Length of wire / cm
Current / A
1 /A−1 current
246
h/cm
d/cm
d2/
1.0
18.0
2.5
28.4
4.0
35.8
5.5
41.6
7.0
47.3
9.0
53.6
Recording results
It is important that you develop the skill of recording results in a clear and concise manner.
Generally, numerical results will be recorded in a table. The table should be neatly drawn using a ruler and each heading in the table should include both the quantity being measured and the unit it is measured in.
Table P1.1 shows how a table may be laid out. The measured quantities are the length of the wire and the current though it; both have their units included. Similarly
the calculated quantity, 1 , is included and this too has a unit, A−1. current
When recording your results, you need to think once more about the precision to which the quantities are measured. In the example in Table P1.1, the length of the wire might be measured to the nearest millimetre and the current might be measured to the nearest milliampere.
10.3 0.682 1.47
19.0 0.350 2.86
Table P1.1 A typical results table. Analysing results
When you have obtained your results the next thing to do is to analyse them. Very often this will be done by plotting a graph.
You may be asked to plot a graph in a particular way however, the general rule is that the variable you control (the independent variable) is plotted on the x-axis and the variable which that changes as a result (the dependent variable) is plotted on the y-axis.
In the example in Table P1.1, the length of the wire would be plotted on the x-axis and the current
Note how ‘.0’ is included in the second result for the length of the wire, to show that the measurement is to the nearest millimetre, not the nearest centimetre. Similarly the zero after the 0.35 shows that it is measured to the nearest milliampere or 1 of an ampere.
(or
1 ) would be plotted on the y-axis. current
1000
The third column is calculated and should show the
You should label your axes with both the quantities you are using and their units. You should then choose your scales to use as much of the graph paper as possible. However, you also need to keep the scales simple. Never choose scales which are multiples of 3, 7, 11 or 13. Try and stick to scales which are simple multiples of 1, 2 or 5.
Plot your points carefully using small crosses; dots tend to disappear into the page and larger dots become blobs, the centre of which is difficult to ascertain.
You are also asked to find the square of the horizontal distance the ball travels after it leaves the ramp.
Table P1.2 shows the raw results for the experiment. Copy and complete the table.
same number of significant figures, or one more than the quantity (or quantities) it is calculated from. In this example the current is measured to three significant figures so the inverse of the current is calculated to three significant figures.
QUESTION
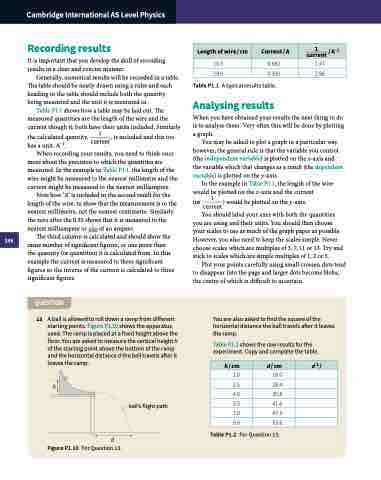
13 A ball is allowed to roll down a ramp from different starting points. Figure P1.10 shows the apparatus used. The ramp is placed at a fixed height above the floor. You are asked to measure the vertical height h of the starting point above the bottom of the ramp and the horizontal distance d the ball travels after it leaves the ramp.
h
ball’s flight path
d
Table P1.2 For Question 13.
Figure P1.10 For Question 13.
