
Page 259 - Physics Coursebook 2015 (A level)
P. 259
P1: Practical skills at AS level
Many, but not all, graphs you meet will be straight lines. The points may not all lie exactly on the straight line and it is your job to choose the best fit line. Choosing this line is a skill which you will develop through the experience of doing practical work.
Generally, there should be equal points either side
of the line (but not three on one side at one end and three on the other at the other end). Sometimes all the points, bar one, lie on the line. The point not on the line is often referred to as an anomalous point, and it should be checked if possible. If it still appears to be off the
line it might be best to ignore it and use the remaining points to give the best line. It is best to mark it clearly as ‘anomalous’.
In Figure P1.11, the line chosen on the first graph is too shallow. By swinging it round so that it is steeper, it goes closer to more points and they are more evenly distributed above and below the line.
y++y++
++ ++ ++ ++
0x0x Figure P1.11
Deductions from graphs
There are two major points of information that can be obtained from straight-line graphs: the gradient and the intercept with the y-axis. When measuring the gradient a triangle should drawn, as in Figure P1.12, using at least half of the line that has been drawn.
gradient = change in y = Δy change in x Δx
In the mathematical equation y = mx + c, m is equal to the gradient of the graph and c is the intercept with the y-axis. If c is equal to zero, the graph passes through the origin, the equation becomes y = mx and we can say that y is proportional to x.
QUESTION
14a Use your results from Question 13 to plot a graph of the height h from which the ball is released against the square of the horizontal distance d2 it travels before it hits the ground. Draw the best fit line.
b Determine the gradient of the line on your graph and the intercept with the y-axis. Remember, both the gradient and the intercept have units; these should be included in your answer.
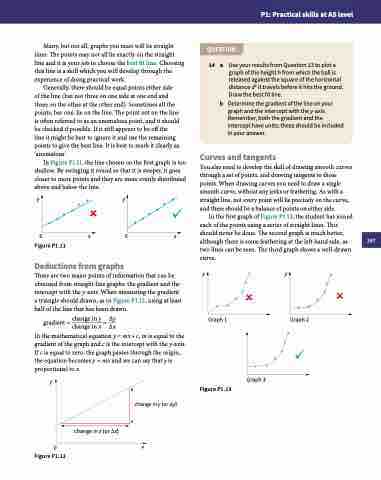
Curves and tangents
You also need to develop the skill of drawing smooth curves through a set of points, and drawing tangents to those points. When drawing curves you need to draw a single smooth curve, without any jerks or feathering. As with a straight line, not every point will lie precisely on the curve, and there should be a balance of points on either side.
In the first graph of Figure P1.13, the student has joined each of the points using a series of straight lines. This should never be done. The second graph is much better, although there is some feathering at the left-hand side, as two lines can be seen. The third graph shows a well-drawn curve.
yy
Graph 1
Figure P1.13
Graph 2
y
0
Graph 3
Figure P1.12
change in x (or ∆x)
change in y (or ∆y)
x
247
