
Page 29 - Physics Coursebook 2015 (A level)
P. 29
Chapter 2: Accelerated motion
Deducing acceleration
The gradient of a velocity–time graph tells us whether the object’s velocity has been changing at a high rate or a low rate, or not at all (Figure 2.4). We can deduce the value of the acceleration from the gradient of the graph:
acceleration = gradient of velocity–time graph
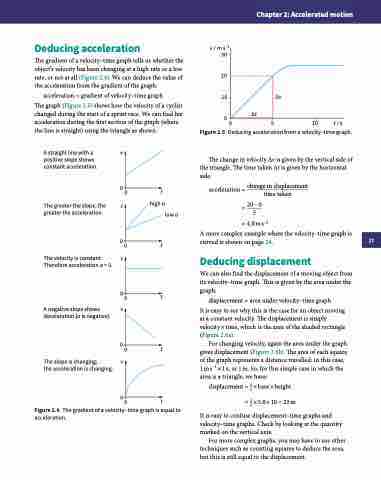
The graph (Figure 2.5) shows how the velocity of a cyclist changed during the start of a sprint race. We can find his acceleration during the first section of the graph (where the line is straight) using the triangle as shown.
A straight line with a v positive slope shows
constant acceleration.
00
The greater the slope, the v greater the acceleration.
v / m s–1 30
20 10
Δv
00t The velocity is constant. v
Therefore acceleration a = 0.
00
A negative slope shows v deceleration (a is negative).
0 0 5
Figure 2.5 Deducing acceleration from a velocity–time graph.
The change in velocity Δv is given by the vertical side of the triangle. The time taken Δt is given by the horizontal side.
acceleration = change in displacement time taken
= 20−0 5
= 4.0 m s−2
A more complex example where the velocity–time graph is
curved is shown on page 24. Deducing displacement
We can also find the displacement of a moving object from its velocity–time graph. This is given by the area under the graph:
displacement = area under velocity–time graph
It is easy to see why this is the case for an object moving at a constant velocity. The displacement is simply velocity × time, which is the area of the shaded rectangle (Figure 2.6a).
For changing velocity, again the area under the graph gives displacement (Figure 2.6b). The area of each square of the graph represents a distance travelled: in this case, 1ms−1 ×1s, or 1m. So, for this simple case in which the area is a triangle, we have:
displacement = 12 × base × height
= 12 ×5.0×10 = 25m
It is easy to confuse displacement–time graphs and velocity–time graphs. Check by looking at the quantity marked on the vertical axis.
For more complex graphs, you may have to use other techniques such as counting squares to deduce the area, but this is still equal to the displacement.
10 t / s
t
high a
low a
The slope is changing;
the acceleration is changing.
t
00t v
00t
Figure 2.4 The gradient of a velocity–time graph is equal to acceleration.
Δt
17
