
Page 30 - Physics Coursebook 2015 (A level)
P. 30
Cambridge International AS Level Physics
area = 20 × 15 = 300 m
18
Velocity / m s−1
0
15
30
30
20
10
0
Time/s
0
5
10
15
20
25
30
a v/ms–1 20
10
00 5 10
b v/ms–1 10
5
15 t/s
(Take care when counting squares: it is easiest when the sides of the squares stand for one unit. Check the axes, as the sides may represent 2 units, or 5 units, or some other number.)
Measuring velocity and acceleration
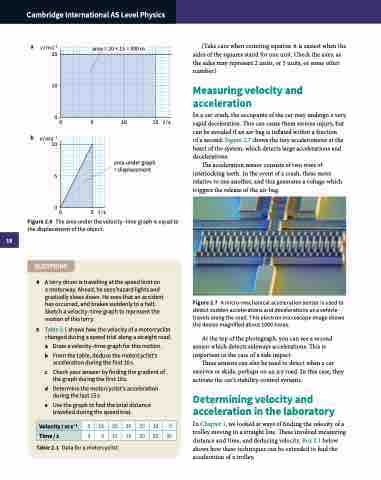
In a car crash, the occupants of the car may undergo a very rapid deceleration. This can cause them serious injury, but can be avoided if an air-bag is inflated within a fraction
of a second. Figure 2.7 shows the tiny accelerometer at the heart of the system, which detects large accelerations and decelerations.
The acceleration sensor consists of two rows of interlocking teeth. In the event of a crash, these move relative to one another, and this generates a voltage which triggers the release of the air-bag.
Figure 2.7 A micro-mechanical acceleration sensor is used to detect sudden accelerations and decelerations as a vehicle travels along the road. This electron microscope image shows the device magnified about 1000 times.
At the top of the photograph, you can see a second sensor which detects sideways accelerations. This is important in the case of a side impact.
These sensors can also be used to detect when a car swerves or skids, perhaps on an icy road. In this case, they activate the car’s stability-control systems.
Determining velocity and acceleration in the laboratory
In Chapter 1, we looked at ways of finding the velocity of a trolley moving in a straight line. These involved measuring distance and time, and deducing velocity. Box 2.1 below shows how these techniques can be extended to find the acceleration of a trolley.
area under graph = displacement
00 5 t/s
Figure 2.6 The area under the velocity–time graph is equal to
the displacement of the object.
QUESTIONS
4 A lorry driver is travelling at the speed limit on a motorway. Ahead, he sees hazard lights and gradually slows down. He sees that an accident has occurred, and brakes suddenly to a halt. Sketch a velocity–time graph to represent the motion of this lorry.
5 Table 2.1 shows how the velocity of a motorcyclist changed during a speed trial along a straight road.
a Draw a velocity–time graph for this motion.
b From the table, deduce the motorcyclist’s
acceleration during the first 10 s.
c Check your answer by finding the gradient of the graph during the first 10 s.
d Determine the motorcyclist’s acceleration during the last 15 s.
e Use the graph to find the total distance travelled during the speed trial.
Table 2.1 Data for a motorcyclist.
