
Page 550 - Physics Coursebook 2015 (A level)
P. 550
Cambridge International A Level Physics
WORKED EXAMPLE
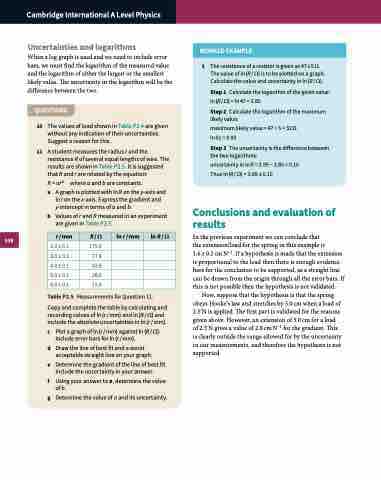
r/mm
R/Ω
lnr/mm
lnR/Ω
2.0 ± 0.1
175.0
3.0 ± 0.1
77.8
4.0 ± 0.1
43.8
5.0 ± 0.1
28.0
6.0 ± 0.1
19.4
538
Uncertainties and logarithms
When a log graph is used and we need to include error bars, we must find the logarithm of the measured value and the logarithm of either the largest or the smallest likely value. The uncertainty in the logarithm will be the difference between the two.
QUESTIONS
10 The values of load shown in Table P2.4 are given without any indication of their uncertainties. Suggest a reason for this.
11 A student measures the radius r and the resistance R of several equal lengths of wire. The results are shown in Table P2.5. It is suggested that R and r are related by the equation:
R = arb where a and b are constants.
a A graph is plotted with ln R on the y-axis and ln r on the x-axis. Express the gradient and y-intercept in terms of a and b.
b Values of r and R measured in an experiment are given in Table P2.5.
Table P2.5 Measurements for Question 11.
Copy and complete the table by calculating and recording values of ln (r / mm) and ln (R / Ω) and include the absolute uncertainties in ln (r / mm).
c Plot a graph of ln(r/mm) against ln(R/Ω). Include error bars for ln (r / mm).
d Draw the line of best fit and a worst acceptable straight line on your graph.
e Determine the gradient of the line of best fit. Include the uncertainty in your answer.
f Using your answer to e, determine the value of b.
g Determine the value of a and its uncertainty.
3 The resistance of a resistor is given as 47 ± 5 Ω. Thevalueofln(R/Ω)istobeplottedonagraph. Calculate the value and uncertainty in ln (R / Ω).
Step1 Calculatethelogarithmofthegivenvalue: ln(R/Ω) = ln47 = 3.85
Step2 Calculatethelogarithmofthemaximum likely value:
maximumlikelyvalue=47+5=52Ω ln52=3.95
Step3 Theuncertaintyisthedifferencebetween the two logarithms:
uncertainty in ln R = 3.95 − 3.85 = 0.10 Thus ln (R / Ω) = 3.85 ± 0.10
Conclusions and evaluation of results
In the previous experiment we can conclude that
the extension/load for the spring in this example is
1.6 ± 0.2 cm N−1. If a hypothesis is made that the extension is proportional to the load then there is enough evidence here for the conclusion to be supported, as a straight line can be drawn from the origin through all the error bars. If this is not possible then the hypothesis is not validated.
Now, suppose that the hypothesis is that the spring obeys Hooke’s law and stretches by 5.0 cm when a load of 2.5 N is applied. The first part is validated for the reasons given above. However, an extension of 5.0 cm for a load of 2.5 N gives a value of 2.0 cm N−1 for the gradient. This is clearly outside the range allowed for by the uncertainty in our measurements, and therefore the hypothesis is not supported.
