
Page 549 - Physics Coursebook 2015 (A level)
P. 549
QUESTIONS
8 You measure the following quantities: A=1.0±0.4m B=2.0±0.2m C=2.0±0.5ms−1 D=0.20±0.01s
Calculate the result and its uncertainty for each of the following expressions. You may express your uncertainty either as an absolute value or as a percentage.
8.0 6.0 4.0 2.0
0 0246
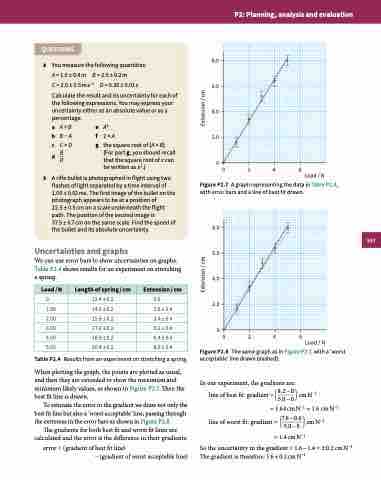
Figure P2.7 A graph representing the data in Table P2.4, with error bars and a line of best fit drawn.
8.0 6.0 4.0 2.0
0
0246
Load / N
Figure P2.8 The same graph as in Figure P2.7, with a ‘worst acceptable’ line drawn (dashed).
e A2
f 2×A
g thesquarerootof(A×B) (For part g, you should recall that the square root of x can bewrittenasx12.)
9 A rifle bullet is photographed in flight using two flashes of light separated by a time interval of 1.00 ± 0.02 ms. The first image of the bullet on the photograph appears to be at a position of
22.5 ± 0.5 cm on a scale underneath the flight path. The position of the second image is
37.5 ± 0.7 cm on the same scale. Find the speed of the bullet and its absolute uncertainty.
Uncertainties and graphs
We can use error bars to show uncertainties on graphs. Table P2.4 shows results for an experiment on stretching a spring.
Load / N
0 1.00 2.00 3.00 4.00 5.00
Table P2.4
Length of spring / cm
12.4 ± 0.2 14.0 ± 0.2 15.8 ± 0.2 17.6 ± 0.2 18.8 ± 0.2 20.4 ± 0.2
Extension / cm
0.0
1.6 ± 0.4 3.4 ± 0.4 5.2 ± 0.4 6.4 ± 0.4 8.0 ± 0.4
a A+B
b B−A
c C×D
d B
D
Results from an experiment on stretching a spring.
When plotting the graph, the points are plotted as usual, and then they are extended to show the maximum and minimum likely values, as shown in Figure P2.7. Then the best fit line is drawn.
To estimate the error in the gradient we draw not only the best fit line but also a ‘worst acceptable’ line, passing through the extremes in the error bars as shown in Figure P2.8.
The gradients for both best fit and worst fit lines are calculated and the error is the difference in their gradients:
error = (gradient of best fit line)
− (gradient of worst acceptable line)
In our experiment, the gradients are:
line of best fit: gradient = 8.2 − 0 cm N−1
P2: Planning, analysis and evaluation
Extension / cm Extension / cm
5.0 − 0
= 1.64 cm N−1 ≈ 1.6 cm N−1
7.6 − 0.6 −1 line of worst fit: gradient = 5.0 − 0 cm N
= 1.4 cm N−1
So the uncertainty in the gradient = 1.6 − 1.4 = ± 0.2 cm N−1 The gradient is therefore: 1.6 ± 0.2 cm N−1.
Load / N
537
