Page 313 - Krugmans Economics for AP Text Book_Neat
P. 313
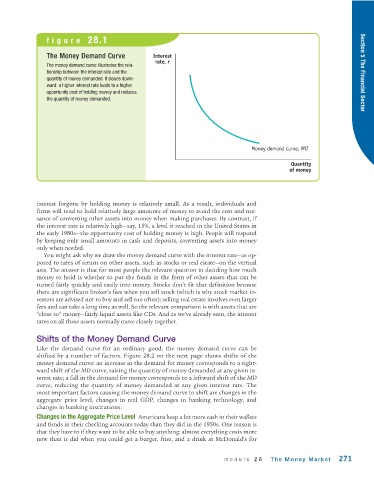
figure 28.1


                The Money Demand Curve             Interest
                                                    rate, r
                The money demand curve illustrates the rela-
                tionship between the interest rate and the                                                             Section 5 The Financial Sector
                quantity of money demanded. It slopes down-
                ward: a higher interest rate leads to a higher
                opportunity cost of holding money and reduces
                the quantity of money demanded.


                                                                                   Money demand curve, MD

                                                                                                Quantity
                                                                                                of money


             interest forgone by holding money is relatively small. As a result, individuals and
             firms will tend to hold relatively large amounts of money to avoid the cost and nui-
             sance of converting other assets into money when making purchases. By contrast, if
             the interest rate is relatively high—say, 15%, a level it reached in the United States in
             the early 1980s—the opportunity cost of holding money is high. People will respond
             by keeping only small amounts in cash and deposits, converting assets into money
             only when needed.
               You might ask why we draw the money demand curve with the interest rate—as op-
             posed to rates of return on other assets, such as stocks or real estate—on the vertical
             axis. The answer is that for most people the relevant question in deciding how much
             money to hold is whether to put the funds in the form of other assets that can be
             turned fairly quickly and easily into money. Stocks don’t fit that definition because
             there are significant broker’s fees when you sell stock (which is why stock market in-
             vestors are advised not to buy and sell too often); selling real estate involves even larger
             fees and can take a long time as well. So the relevant comparison is with assets that are
             “close to” money—fairly liquid assets like CDs. And as we’ve already seen, the interest
             rates on all these assets normally move closely together.

             Shifts of the Money Demand Curve
             Like the demand curve for an ordinary good, the money demand curve can be
             shifted by a number of factors. Figure 28.2 on the next page shows shifts of the
             money demand curve: an increase in the demand for money corresponds to a right-
             ward shift of the MD curve, raising the quantity of money demanded at any given in-
             terest rate; a fall in the demand for money corresponds to a leftward shift of the MD
             curve, reducing the quantity of money demanded at any given interest rate. The
             most important factors causing the money demand curve to shift are changes in the
             aggregate price level, changes in real GDP, changes in banking technology, and
             changes in banking institutions.
             Changes in the Aggregate Price Level Americans keep a lot more cash in their wallets
             and funds in their checking accounts today than they did in the 1950s. One reason is
             that they have to if they want to be able to buy anything: almost everything costs more
             now than it did when you could get a burger, fries, and a drink at McDonald’s for


                                                                          module 28       The Money Market      271

