Page 487 - Krugmans Economics for AP Text Book_Neat
P. 487

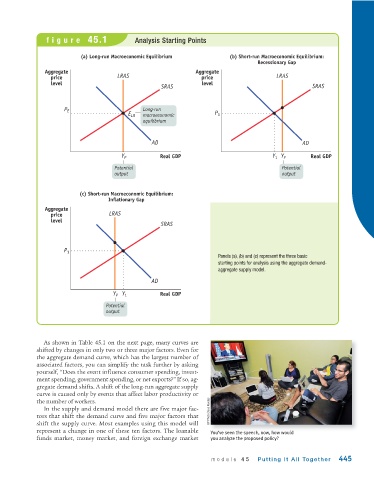
figure 45.1                  Analysis Starting Points


                           (a) Long-run Macroeconomic Equilibrium           (b) Short-run Macroeconomic Equilibrium:
                                                                                     Recessionary Gap
                Aggregate                                        Aggregate
                  price                LRAS                        price                   LRAS
                  level                                            level
                                                      SRAS                                             SRAS


                      P E                       Long-run
                                           E LR  macroeconomic         P 1
                                                equilibrium


                                                   AD                                               AD
                                         Y P         Real GDP                             Y 1  Y P     Real GDP

                                      Potential                                              Potential
                                      output                                                 output


                           (c) Short-run Macroeconomic Equilibrium:
                                    Inflationary Gap
                Aggregate
                  price              LRAS
                  level
                                                      SRAS


                      P 1
                                                                        Panels (a), (b) and (c) represent the three basic
                                                                        starting points for analysis using the aggregate demand-
                                                                        aggregate supply model.
                                                   AD
                                      Y P  Y 1       Real GDP

                                    Potential
                                    output


               As shown in Table 45.1 on the next page, many curves are
             shifted by changes in only two or three major factors. Even for
             the aggregate demand curve, which has the largest number of
             associated factors, you can simplify the task further by asking
             yourself, “Does the event influence consumer spending, invest-
             ment spending, government spending, or net exports?” If so, ag-
             gregate demand shifts. A shift of the long-run aggregate supply
             curve is caused only by events that affect labor productivity or
             the number of workers.
               In the supply and demand model there are five major fac-  AP Photo/Gus Ruelas
             tors that shift the demand curve and five major factors that
             shift the supply curve. Most examples using this model will
             represent a change in one of these ten factors. The loanable  You’ve seen the speech, now, how would
             funds market, money market, and foreign exchange market  you analyze the proposed policy?


                                                                      module 45      Putting It All Together    445
   482   483   484   485   486   487   488   489   490   491   492