Page 493 - Krugmans Economics for AP Text Book_Neat
P. 493
2. What is the effect of Mexico’s falling income on the demand for  level change on the demand and on the exchange rate, for
               money and the nominal interest rate in Mexico?       Mexican pesos?
               Demand for money    Nominal interest rate            Demand for pesos    Exchange rate
               a. increases           decreases                     a. increases       appreciates
               b. decreases           decreases                     b. increases       depreciates
               c. increases           increases                     c. decreases       appreciates
               d. decreases           increases                     d. decreases       depreciates
               e. increases           unchanged                     e. decreases       is unchanged
             3. If the aggregate price level in Mexico decreases, what will  5. If the Mexican government pursues expansionary fiscal
               happen to the real interest rate?                    policy in response to the recession, what will happen to
               a. It will increase.                                 aggregate demand and aggregate supply in the short-run?  Section 8 The Open Economy: International Trade and Finance
               b. It will decrease.                                 Aggregate demand   Short-run aggregate supply
               c. It will be unchanged.                             a. increase              increase
               d. It will stabilize.                                b. increase              decrease
               e. It cannot be determined.                          c. decrease              increase
                                                                    d. decrease              decrease
             4. Suppose the aggregate price level in Mexico decreases relative
                                                                    e. increase              no change
               to that in the United States. What is the effect of this price

             Tackle the Test: Free-Response Questions
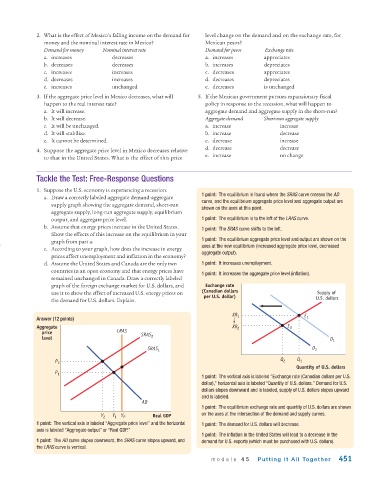
             1. Suppose the U.S. economy is experiencing a recession.
                                                                   1 point: The equilibrium is found where the SRAS curve crosses the AD
               a. Draw a correctly labeled aggregate demand-aggregate
                                                                   curve, and the equilibrium aggregate price level and aggregate output are
                  supply graph showing the aggregate demand, short-run
                                                                   shown on the axes at this point.
                  aggregate supply, long-run aggregate supply, equilibrium
                  output, and aggregate price level.               1 point: The equilibrium is to the left of the LRAS curve.
               b. Assume that energy prices increase in the United States.  1 point: The SRAS curve shifts to the left.
                  Show the effects of this increase on the equilibrium in your
                                                                   1 point: The equilibrium aggregate price level and output are shown on the
                  graph from part a.
                                                                   axes at the new equilibrium (increased aggregate price level, decreased
               c. According to your graph, how does the increase in energy
                                                                   aggregate output).
                  prices affect unemployment and inflation in the economy?
               d. Assume the United States and Canada are the only two  1 point: It increases unemployment.
                  countries in an open economy and that energy prices have
                                                                   1 point: It increases the aggregate price level (inflation).
                  remained unchanged in Canada. Draw a correctly labeled
                  graph of the foreign exchange market for U.S. dollars, and  Exchange rate
                                                                   (Canadian dollars
                  use it to show the effect of increased U.S. energy prices on                           Supply of
                                                                    per U.S. dollar)                    U.S. dollars
                  the demand for U.S. dollars. Explain.
                                                                             XR 1                    E
             Answer (12 points)                                                                      1
             Aggregate                                                       XR 2              E 2
               price                   LRAS    SRAS
               level                               2                                                         D 1
                                                 SRAS 1                                                D 2
                   P 2                                                                       Q 2  Q 1
                                                                                                  Quantity of U.S. dollars
                   P 1
                                                                   1 point: The vertical axis is labeled “Exchange rate (Canadian dollars per U.S.
                                                                   dollar),” horizontal axis is labeled “Quantity of U.S. dollars.” Demand for U.S.
                                                                   dollars slopes downward and is labeled, supply of U.S. dollars slopes upward
                                                                   and is labeled.
                                               AD
                                                                   1 point: The equilibrium exchange rate and quantity of U.S. dollars are shown
                                  Y 2  Y 1  Y P    Real GDP        on the axes at the intersection of the demand and supply curves.
             1 point: The vertical axis is labeled “Aggregate price level” and the horizontal  1 point: The demand for U.S. dollars will decrease.
             axis is labeled “Aggregate output” or “Real GDP.”
                                                                   1 point: The inflation in the United States will lead to a decrease in the
             1 point: The AD curve slopes downward, the SRAS curve slopes upward, and  demand for U.S. exports (which must be purchased with U.S. dollars).
             the LRAS curve is vertical.
                                                                      module 45      Putting It All Together    451

