Page 520 - Krugmans Economics for AP Text Book_Neat
P. 520
1 (10%/10%) and supply is unit-elastic. If the quantity supplied increases by 5%, the
        There is perfectly inelastic supply when
                                       price elasticity of supply is 0.5 and supply is inelastic; if the quantity increases by 20%,
        the price elasticity of supply is zero, so that
                                       the price elasticity of supply is 2 and supply is elastic.
        changes in the price of the good have no
                                          As in the case of demand, the extreme values of the price elasticity of supply have a
        effect on the quantity supplied. A perfectly
        inelastic supply curve is a vertical line.  simple graphical representation. Panel (a) of Figure 48.1 shows the supply of cell phone
                                       frequencies, the portion of the radio spectrum that is suitable for sending and receiv-
                                       ing cell phone signals. Governments own the right to sell the use of this part of the
                                       radio spectrum to cell phone operators inside their borders. But governments can’t in-
                                       crease or decrease the number of cell phone frequencies they have to offer—for techni-
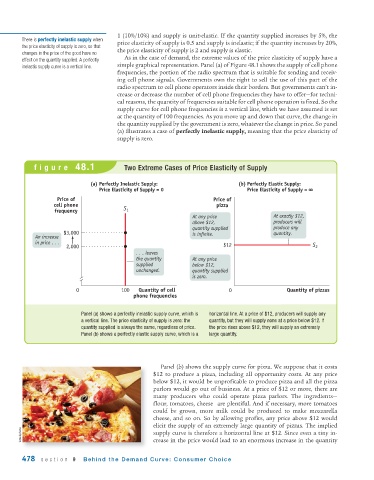
                                       cal reasons, the quantity of frequencies suitable for cell phone operation is fixed. So the
                                       supply curve for cell phone frequencies is a vertical line, which we have assumed is set
                                       at the quantity of 100 frequencies. As you move up and down that curve, the change in
                                       the quantity supplied by the government is zero, whatever the change in price. So panel
                                       (a) illustrates a case of perfectly inelastic supply, meaning that the price elasticity of
                                       supply is zero.


            figure 48.1                   Two Extreme Cases of Price Elasticity of Supply


                               (a) Perfectly Inelastic Supply:                 (b) Perfectly Elastic Supply:

                                  Price Elasticity of Supply = 0                  Price Elasticity of Supply =
                    Price of                                           Price of
                   cell phone                                           pizza
                   frequency             S 1
                                                                At any price               At exactly $12,
                                                                above $12,                 producers will
                                                                quantity supplied          produce any
                      $3,000                                                               quantity.
             An increase                                        is infinite.
             in price . . .                                               $12
                       2,000                                                                           S 2
                                              . . . leaves
                                              the quantity      At any price
                                              supplied          below $12,
                                              unchanged.        quantity supplied
                                                                is zero.
                          0              100  Quantity of cell              0                  Quantity of pizzas
                                             phone frequencies


                            Panel (a) shows a perfectly inelastic supply curve, which is  horizontal line. At a price of $12, producers will supply any
                            a vertical line. The price elasticity of supply is zero: the  quantity, but they will supply none at a price below $12. If
                            quantity supplied is always the same, regardless of price.  the price rises above $12, they will supply an extremely
                            Panel (b) shows a perfectly elastic supply curve, which is a  large quantity.


                                                      Panel (b) shows the supply curve for pizza. We suppose that it costs
                                                   $12 to produce a pizza, including all opportunity costs. At any price
                                                   below $12, it would be unprofitable to produce pizza and all the pizza
                                                   parlors would go out of business. At a price of $12 or more, there are
                                                   many producers who could operate pizza parlors. The ingredients—
                                                   flour, tomatoes, cheese—are plentiful. And if necessary, more tomatoes
                                                   could be grown, more milk could be produced to make mozzarella
                                                   cheese, and so on. So by allowing profits, any price above $12 would
                                                   elicit the supply of an extremely large quantity of pizzas. The implied
        istockphoto                                supply curve is therefore a horizontal line at $12. Since even a tiny in-
                                                   crease in the price would lead to an enormous increase in the quantity

        478   section 9     Behind the Demand Curve: Consumer Choice

