
Page 593 - Krugmans Economics for AP Text Book_Neat
P. 593
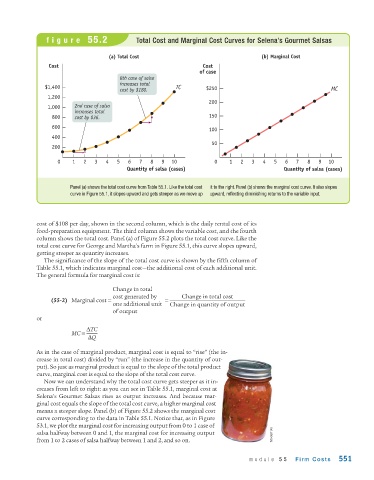
figure   55.2                 Total Cost and Marginal Cost Curves for Selena’s Gourmet Salsas


                                     (a) Total Cost                                    (b) Marginal Cost
                 Cost                                              Cost
                                                                  of case
                                        8th case of salsa
                $1,400                  increases total    TC       $250
                                        cost by $180.                                                        MC
                 1,200
                                                                     200
                 1,000   2nd case of salsa
                         increases total
                  800    cost by $36.                                150
                  600                                                100
                  400
                                                                      50
                  200

                    0    1  2   3   4  5   6   7  8   9  10            0    1   2  3   4   5  6   7   8  9   10
                                           Quantity of salsa (cases)                          Quantity of salsa (cases)


                        Panel (a) shows the total cost curve from Table 55.1. Like the total cost  it to the right. Panel (b) shows the marginal cost curve. It also slopes
                        curve in Figure 55.1, it slopes upward and gets steeper as we move up  upward, reflecting diminishing returns to the variable input.


             cost of $108 per day, shown in the second column, which is the daily rental cost of its
             food-preparation equipment. The third column shows the variable cost, and the fourth
             column shows the total cost. Panel (a) of Figure 55.2 plots the total cost curve. Like the
             total cost curve for George and Martha’s farm in Figure 55.1, this curve slopes upward,
             getting steeper as quantity increases.
               The significance of the slope of the total cost curve is shown by the fifth column of
             Table 55.1, which indicates marginal cost—the additional cost of each additional unit.
             The general formula for marginal cost is:
                                      Change in total
                  (55-2) Marginal cost =  cost generated by  =  Change in total cost
                                      one additional unit  Change in quantity of output
                                      of output
             or

                        MC =  ΔTC
                              ΔQ

             As in the case of marginal product, marginal cost is equal to “rise” (the in-
             crease in total cost) divided by “run” (the increase in the quantity of out-
             put). So just as marginal product is equal to the slope of the total product
             curve, marginal cost is equal to the slope of the total cost curve.
               Now we can understand why the total cost curve gets steeper as it in-
             creases from left to right: as you can see in Table 55.1, marginal cost at
             Selena’s  Gourmet  Salsas  rises  as  output  increases.  And  because  mar-
             ginal cost equals the slope of the total cost curve, a higher marginal cost
             means a steeper slope. Panel (b) of Figure 55.2 shows the marginal cost
             curve corresponding to the data in Table 55.1. Notice that, as in Figure
             53.1, we plot the marginal cost for increasing output from 0 to 1 case of
             salsa halfway between 0 and 1, the marginal cost for increasing output       iStockphoto
             from 1 to 2 cases of salsa halfway between 1 and 2, and so on.


                                                                                   module   55    Firm Costs    551