Page 360 - Understanding Psychology
P. 360
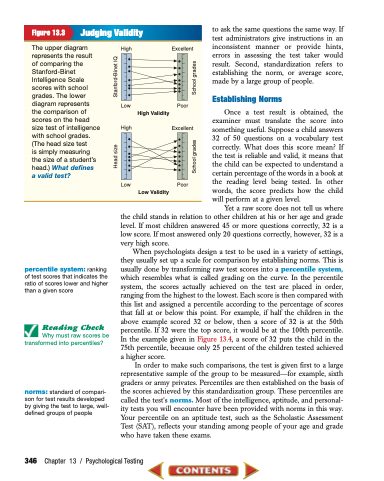
   Figure 13.3 Judging Validity
 The upper diagram High represents the result
of comparing the
Stanford-Binet
Intelligence Scale
scores with school
grades. The lower
diagram represents
the comparison of
scores on the head
size test of intelligence High with school grades.
Excellent
Poor
Excellent
Poor
       Low
High Validity
   (The head size test
is simply measuring the size of a student’s head.) What defines a valid test?
Low
Low Validity
  percentile system: ranking of test scores that indicates the ratio of scores lower and higher than a given score
Reading Check
Why must raw scores be transformed into percentiles?
norms: standard of compari- son for test results developed by giving the test to large, well- defined groups of people
to ask the same questions the same way. If test administrators give instructions in an inconsistent manner or provide hints, errors in assessing the test taker would result. Second, standardization refers to establishing the norm, or average score, made by a large group of people.
Establishing Norms
Once a test result is obtained, the examiner must translate the score into something useful. Suppose a child answers 32 of 50 questions on a vocabulary test correctly. What does this score mean? If the test is reliable and valid, it means that the child can be expected to understand a certain percentage of the words in a book at the reading level being tested. In other words, the score predicts how the child will perform at a given level.
Yet a raw score does not tell us where the child stands in relation to other children at his or her age and grade level. If most children answered 45 or more questions correctly, 32 is a low score. If most answered only 20 questions correctly, however, 32 is a
very high score.
When psychologists design a test to be used in a variety of settings,
they usually set up a scale for comparison by establishing norms. This is usually done by transforming raw test scores into a percentile system, which resembles what is called grading on the curve. In the percentile system, the scores actually achieved on the test are placed in order, ranging from the highest to the lowest. Each score is then compared with this list and assigned a percentile according to the percentage of scores that fall at or below this point. For example, if half the children in the above example scored 32 or below, then a score of 32 is at the 50th percentile. If 32 were the top score, it would be at the 100th percentile. In the example given in Figure 13.4, a score of 32 puts the child in the 75th percentile, because only 25 percent of the children tested achieved a higher score.
In order to make such comparisons, the test is given first to a large representative sample of the group to be measured—for example, sixth graders or army privates. Percentiles are then established on the basis of the scores achieved by this standardization group. These percentiles are called the test’s norms. Most of the intelligence, aptitude, and personal- ity tests you will encounter have been provided with norms in this way. Your percentile on an aptitude test, such as the Scholastic Assessment Test (SAT), reflects your standing among people of your age and grade who have taken these exams.
  346 Chapter 13 / Psychological Testing
 Head size Stanford-Binet IQ
School grades School grades


