Page 361 - Understanding Psychology
P. 361
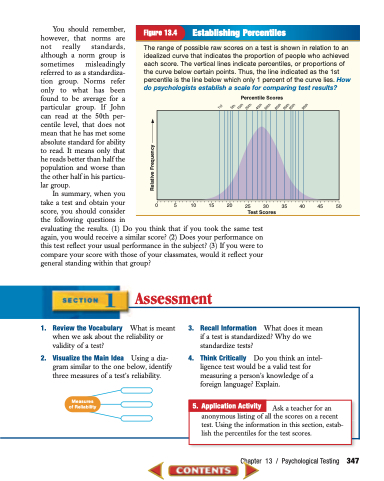
  Figure 13.4 Establishing Percentiles
 The range of possible raw scores on a test is shown in relation to an idealized curve that indicates the proportion of people who achieved each score. The vertical lines indicate percentiles, or proportions of the curve below certain points. Thus, the line indicated as the 1st percentile is the line below which only 1 percent of the curve lies. How do psychologists establish a scale for comparing test results?
Percentile Scores
 0 5 10 15 20 25 30 35 40 45 50
Test Scores
  1. Review the Vocabulary What is meant when we ask about the reliability or validity of a test?
2. Visualize the Main Idea Using a dia- gram similar to the one below, identify three measures of a test’s reliability.
Measures of Reliability
3. Recall Information What does it mean if a test is standardized? Why do we standardize tests?
4. Think Critically Do you think an intel- ligence test would be a valid test for measuring a person’s knowledge of a foreign language? Explain.
    5. Application Activity
Ask a teacher for an anonymous listing of all the scores on a recent
test. Using the information in this section, estab- lish the percentiles for the test scores.
   You should remember, however, that norms are not really standards, although a norm group is sometimes misleadingly referred to as a standardiza- tion group. Norms refer only to what has been found to be average for a particular group. If John can read at the 50th per- centile level, that does not mean that he has met some absolute standard for ability to read. It means only that he reads better than half the population and worse than the other half in his particu- lar group.
In summary, when you
take a test and obtain your
score, you should consider
the following questions in
evaluating the results. (1) Do you think that if you took the same test again, you would receive a similar score? (2) Does your performance on this test reflect your usual performance in the subject? (3) If you were to compare your score with those of your classmates, would it reflect your general standing within that group?
Assessment
      Chapter
13 /
Psychological Testing 347
 1st
5th 10th
20th 40th
60th
80th
90th 95th
99th
Relative Frequency


