Page 313 - Geosystems An Introduction to Physical Geography 4th Canadian Edition
P. 313
 60° 50° 40° 30°
160° 10°
60°
50°
50° 40° 30°
50°
40°
30°
20°
70°
80° ARCTIC OCEAN
20° PACIFIC
OCEAN
ARCTIC OCEAN
Arctic Circle
0° 140° 130° 120° Equator
100° 90°
60° 70° INDIAN
110° cm
over 150–199 30° 100–149 50–99 25–49 50° Under 25
10°
20° 200 and
20° 30° 40° 50°
40°
30° 40°
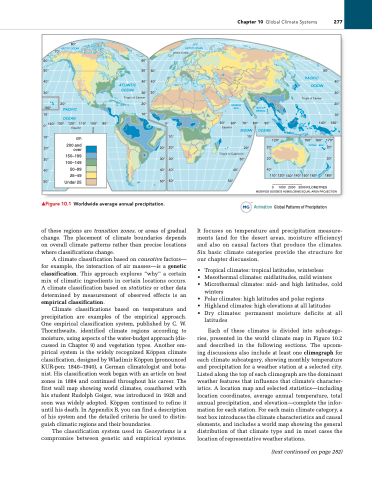
▲Figure 10.1 Worldwide average annual precipitation.
of these regions are transition zones, or areas of gradual change. The placement of climate boundaries depends on overall climate patterns rather than precise locations where classifications change.
A climate classification based on causative factors— for example, the interaction of air masses—is a genetic classification. This approach explores “why” a certain mix of climatic ingredients in certain locations occurs. A climate classification based on statistics or other data determined by measurement of observed effects is an empirical classification.
Climate classifications based on temperature and precipitation are examples of the empirical approach. One empirical classification system, published by C. W. Thornthwaite, identified climate regions according to moisture, using aspects of the water-budget approach (dis- cussed in Chapter 9) and vegetation types. Another em- pirical system is the widely recognized Köppen climate classification, designed by Wladimir Köppen (pronounced KUR-pen; 1846–1940), a German climatologist and bota- nist. His classification work began with an article on heat zones in 1884 and continued throughout his career. The first wall map showing world climates, coauthored with his student Rudolph Geiger, was introduced in 1928 and soon was widely adopted. Köppen continued to refine it until his death. In Appendix B, you can find a description of his system and the detailed criteria he used to distin- guish climatic regions and their boundaries.
The classification system used in Geosystems is a compromise between genetic and empirical systems.
40° OCEAN 30°
Tropic of Cancer 20°
10°
PACIFIC OCEAN
Tropic of Cancer
ATLANTIC
ARABIAN SEA
Chapter 10 Global Climate Systems 277
BAY OF BENGAL
80° 90° OCEAN
120° 20°
30° 110° 120° 130° 140° 150° 160° 180°
0 1000 2000 3000 KILOMETRES MODIFIED GOODE’S HOMOLOSINE EQUAL-AREA PROJECTION
Animation Global Patterns of Precipitation
It focuses on temperature and precipitation measure- ments (and for the desert areas, moisture efficiency) and also on causal factors that produce the climates. Six basic climate categories provide the structure for our chapter discussion.
• Tropical climates: tropical latitudes, winterless
• Mesothermal climates: midlatitudes, mild winters
• Microthermal climates: mid- and high latitudes, cold
winters
• Polar climates: high latitudes and polar regions
• Highland climates: high elevations at all latitudes
• Dry climates: permanent moisture deficits at all
latitudes
Each of these climates is divided into subcatego- ries, presented in the world climate map in Figure 10.2 and described in the following sections. The upcom- ing discussions also include at least one climograph for each climate subcategory, showing monthly temperature and precipitation for a weather station at a selected city. Listed along the top of each climograph are the dominant weather features that influence that climate’s character- istics. A location map and selected statistics—including location coordinates, average annual temperature, total annual precipitation, and elevation—complete the infor- mation for each station. For each main climate category, a text box introduces the climate characteristics and causal elements, and includes a world map showing the general distribution of that climate type and in most cases the location of representative weather stations.
0° 50° Equator
10° 10°
20° 20° Tropic of Capricorn
30° 30° 40° 40°
50° 50°
10° 140° 150°
150° 160° 170° CORAL SEA 20°
(text continued on page 282)


