Page 349 - Geosystems An Introduction to Physical Geography 4th Canadian Edition
P. 349
Chapter 11 Climate Change 313
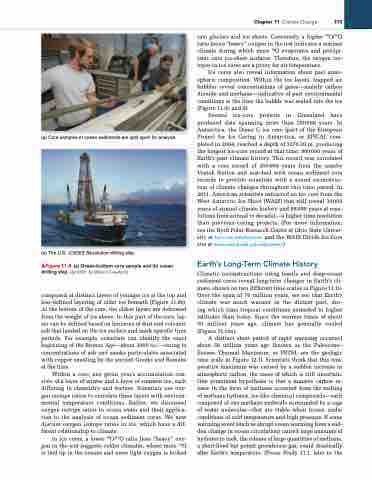
   (a) Core samples of ocean sediments are split open for analysis.
into glaciers and ice sheets. Conversely, a higher 18O/16O ratio (more “heavy” oxygen in the ice) indicates a warmer climate during which more 18O evaporates and precipi- tates onto ice-sheet surfaces. Therefore, the oxygen iso- topes in ice cores are a proxy for air temperature.
Ice cores also reveal information about past atmo- spheric composition. Within the ice layers, trapped air bubbles reveal concentrations of gases—mainly carbon dioxide and methane—indicative of past environmental conditions at the time the bubble was sealed into the ice (Figure 11.9c and d).
Several ice-core projects in Greenland have produced data spanning more than 250000 years. In Antarctica, the Dome C ice core (part of the European Project for Ice Coring in Antarctica, or EPICA), com- pleted in 2004, reached a depth of 3270.20 m, producing the longest ice-core record at that time: 800000 years of Earth’s past climate history. This record was correlated with a core record of 400000 years from the nearby Vostok Station and matched with ocean sediment core records to provide scientists with a sound reconstruc- tion of climate changes throughout this time period. In 2011, American scientists extracted an ice core from the West Antarctic Ice Sheet (WAIS) that will reveal 30000 years of annual climate history and 68000 years at reso- lutions from annual to decadal—a higher time resolution than previous coring projects. (For more information, see the Byrd Polar Research Center at Ohio State Univer- sity at bprc.osu.edu/Icecore/ and the WAIS Divide Ice Core site at www.waisdivide.unh.edu/news/.)
Earth’s Long-Term Climate History
Climatic reconstructions using fossils and deep-ocean sediment cores reveal long-term changes in Earth’s cli- mate, shown on two different time scales in Figure 11.10. Over the span of 70 million years, we see that Earth’s climate was much warmer in the distant past, dur- ing which time tropical conditions extended to higher latitudes than today. Since the warmer times of about 50 million years ago, climate has generally cooled (Figure 11.10a).
A distinct short period of rapid warming occurred about 56 million years ago (known as the Paleocene– Eocene Thermal Maximum, or PETM; see the geologic time scale in Figure 12.1). Scientists think that this tem- perature maximum was caused by a sudden increase in atmospheric carbon, the cause of which is still uncertain. One prominent hypothesis is that a massive carbon re- lease in the form of methane occurred from the melting of methane hydrates, ice-like chemical compounds—each composed of one methane molecule surrounded by a cage of water molecules—that are stable when frozen under conditions of cold temperature and high pressure. If some warming event (such as abrupt ocean warming from a sud- den change in ocean circulation) caused large amounts of hydrates to melt, the release of large quantities of methane, a short-lived but potent greenhouse gas, could drastically alter Earth’s temperature. (Focus Study 11.1, later in the
  (b) The U.S. JOIDES Resolution drilling ship.
▲Figure 11.8 (a) Ocean-bottom core sample and (b) ocean
drilling ship. [(a) iODP. (b) William Crawford.]
composed of distinct layers of younger ice at the top and less-defined layering of older ice beneath (Figure 11.9b). At the bottom of the core, the oldest layers are deformed from the weight of ice above. In this part of the core, lay- ers can be defined based on horizons of dust and volcanic ash that landed on the ice surface and mark specific time periods. For example, scientists can identify the exact beginning of the Bronze Age—about 3000 b.c.—owing to concentrations of ash and smoke particulates associated with copper smelting by the ancient Greeks and Romans at the time.
Within a core, any given year’s accumulation con- sists of a layer of winter and a layer of summer ice, each differing in chemistry and texture. Scientists use oxy- gen isotope ratios to correlate these layers with environ- mental temperature conditions. Earlier, we discussed oxygen isotope ratios in ocean water and their applica- tion to the analysis of ocean sediment cores. We now discuss oxygen isotope ratios in ice, which have a dif- ferent relationship to climate.
In ice cores, a lower 18O/16O ratio (less “heavy” oxy- gen in the ice) suggests colder climates, where more 18O is tied up in the oceans and more light oxygen is locked


