Page 362 - Geosystems An Introduction to Physical Geography 4th Canadian Edition
P. 362
 326 part II The Water, Weather, and Climate Systems
                     0.6 0.4 0.2
0 –0.2 –0.4
Annual mean 5 year mean
    Mount Pinatubo
effect
  1880 1890 1900 1910 1920 1930 1940 1950 1960 1970 1980 1990 2000 2010 Year
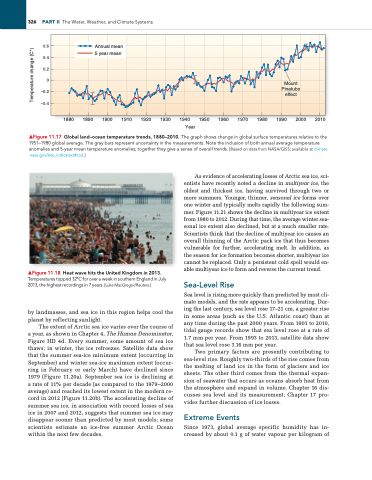
▲Figure 11.17 Global land–ocean temperature trends, 1880–2010. The graph shows change in global surface temperatures relative to the 1951–1980 global average. The gray bars represent uncertainty in the measurements. note the inclusion of both annual average temperature anomalies and 5-year mean temperature anomalies; together they give a sense of overall trends. [Based on data from naSa/giSS; available at climate .nasa.gov/key_indicators#co2.]
  ▲Figure 11.18 Heat wave hits the United Kingdom in 2013. Temperatures topped 32°C for over a week in southern england in July 2013, the highest recordings in 7 years. [luke Macgregor/reuters.]
by landmasses, and sea ice in this region helps cool the planet by reflecting sunlight.
The extent of Arctic sea ice varies over the course of a year, as shown in Chapter 4, The Human Denominator, Figure HD 4d. Every summer, some amount of sea ice thaws; in winter, the ice refreezes. Satellite data show that the summer sea-ice minimum extent (occurring in September) and winter sea-ice maximum extent (occur- ring in February or early March) have declined since 1979 (Figure 11.20a). September sea ice is declining at a rate of 11% per decade (as compared to the 1979–2000 average) and reached its lowest extent in the modern re- cord in 2012 (Figure 11.20b). The accelerating decline of summer sea ice, in association with record losses of sea ice in 2007 and 2012, suggests that summer sea ice may disappear sooner than predicted by most models; some scientists estimate an ice-free summer Arctic Ocean within the next few decades.
As evidence of accelerating losses of Arctic sea ice, sci- entists have recently noted a decline in multiyear ice, the oldest and thickest ice, having survived through two or more summers. Younger, thinner, seasonal ice forms over one winter and typically melts rapidly the following sum- mer. Figure 11.21 shows the decline in multiyear ice extent from 1980 to 2012. During that time, the average winter sea- sonal ice extent also declined, but at a much smaller rate. Scientists think that the decline of multiyear ice causes an overall thinning of the Arctic pack ice that thus becomes vulnerable for further, accelerating melt. In addition, as the season for ice formation becomes shorter, multiyear ice cannot be replaced. Only a persistent cold spell would en- able multiyear ice to form and reverse the current trend.
Sea-Level Rise
Sea level is rising more quickly than predicted by most cli- mate models, and the rate appears to be accelerating. Dur- ing the last century, sea level rose 17–21 cm, a greater rise in some areas (such as the U.S. Atlantic coast) than at any time during the past 2000 years. From 1901 to 2010, tidal gauge records show that sea level rose at a rate of 1.7 mm per year. From 1993 to 2013, satellite data show that sea level rose 3.16 mm per year.
Two primary factors are presently contributing to sea-level rise. Roughly two-thirds of the rise comes from the melting of land ice in the form of glaciers and ice sheets. The other third comes from the thermal expan- sion of seawater that occurs as oceans absorb heat from the atmosphere and expand in volume. Chapter 16 dis- cusses sea level and its measurement; Chapter 17 pro- vides further discussion of ice losses.
Extreme Events
Since 1973, global average specific humidity has in- creased by about 0.1 g of water vapour per kilogram of
Temperature change (C°)


