Page 364 - Geosystems An Introduction to Physical Geography 4th Canadian Edition
P. 364
 328 part II The Water, Weather, and Climate Systems
  20 10 0 –10 –20 –30 –40 –50
Causes of Present Climate Change
Both the long-term proxy records and the short- term instrumental records show that fluctua- tions in the average surface temperature of the Earth correlate with fluctuations in the concen- tration of CO2 in the atmosphere. Furthermore, as previously discussed, studies indicate that high levels of atmospheric carbon can act as a climate feedback that amplifies short-term tem- perature changes. At present, data show that record-high global temperatures have domi- nated the past two decades—for both land and ocean and for both day and night—in step with record-high levels of CO2 in the atmosphere.
Scientists agree that rising concentrations of greenhouse gases in the atmosphere are the primary cause of recent worldwide temperature increases. As discussed earlier, CO2 emissions associated with the burning of fossil fuels, pri- marily coal, oil, and natural gas, have increased with growing human population and rising standard of living. But how can scientists be sure that the primary source of atmospheric CO2 over the past 150 years is from human rather than natural factors?
Scientists track the amount of carbon burned by humans over periods of years or decades by estimating the amount of CO2 released by dif- ferent activities. For example, the amount of CO2 emitted at a particular facility can be com- puted by estimating the amount of fuel burned multiplied by the amount of carbon in the fuel. Although some large power plants now have de- vices on smoke stacks to measure exact emission rates, estimation is the more common practice and is now standardized worldwide.
 1980 1985
1990 1995 Year
2000
2005
2010
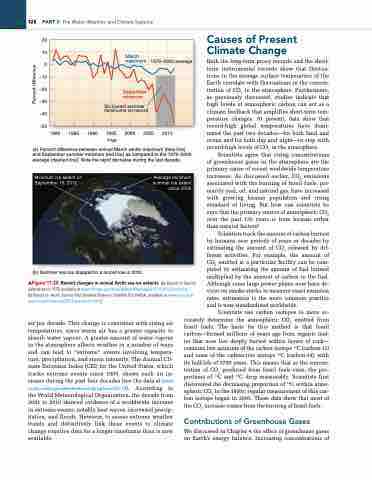
(a) Percent difference between annual March winter maximum (blue line) and September summer minimum (red line) as compared to the 1979–2000 average (dashed line). Note the rapid decrease during the last decade.
(b) Summer sea ice dropped to a record low in 2012.
▲Figure 11.20 recent changes in annual Arctic sea-ice extents. [(a) Based on Sea ice extents since 1979, available at www.climate.gov/sites/default/files/seaice1979-2012_final.png.
(b) Based on Arctic Sea Ice Hits Smallest Extent In Satellite Era, naSa, available at www.nasa.gov/ topics/earth/features/2012-seaicemin.html.]
 air per decade. This change is consistent with rising air temperatures, since warm air has a greater capacity to absorb water vapour. A greater amount of water vapour in the atmosphere affects weather in a number of ways and can lead to “extreme” events involving tempera- ture, precipitation, and storm intensity. The Annual Cli- mate Extremes Index (CEI) for the United States, which tracks extreme events since 1900, shows such an in- crease during the past four decades (see the data at www .ncdc.noaa.gov/extremes/cei/graph/cei/01-12). According to the World Meteorological Organization, the decade from 2001 to 2010 showed evidence of a worldwide increase in extreme events, notably heat waves, increased precip- itation, and floods. However, to assess extreme weather trends and definitively link these events to climate change requires data for a longer timeframe than is now available.
Scientists use carbon isotopes to more ac- curately determine the atmospheric CO2 emitted from fossil fuels. The basis for this method is that fossil carbon—formed millions of years ago from organic mat- ter that now lies deeply buried within layers of rock— contains low amounts of the carbon isotope 13C (carbon-13) and none of the radioactive isotope 14C (carbon-14), with its half-life of 5730 years. This means that as the concen- tration of CO2 produced from fossil fuels rises, the pro- portions of 13C and 14C drop measurably. Scientists first discovered the decreasing proportion of 14C within atmo- spheric CO2 in the 1950s; regular measurement of this car- bon isotope began in 2003. These data show that most of the CO2 increase comes from the burning of fossil fuels.
Contributions of Greenhouse Gases
We discussed in Chapter 4 the effect of greenhouse gases on Earth’s energy balance. Increasing concentrations of
March maximum
September minimum
Six lowest summer minimums on record
1979–2000 average
 Minimum ice extent on Average minimum September 16, 2012 summer ice extent since 2000
   Percent difference


