Page 530 - Geosystems An Introduction to Physical Geography 4th Canadian Edition
P. 530
 494 part III The earth–atmosphere interface
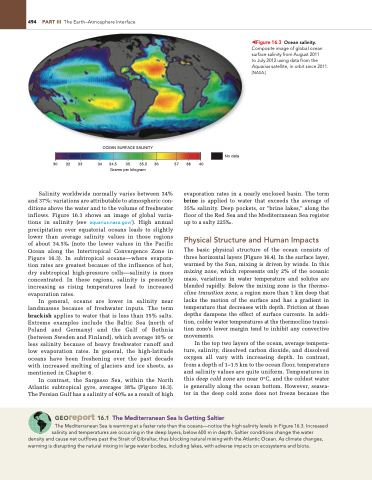
  ◀Figure 16.3 Ocean salinity. Composite image of global ocean surface salinity from august 2011
to July 2012 using data from the Aquarius satellite, in orbit since 2011. [naSa.]
 30 32 33
37 38 40
OCEAN SURFACE SALINITY
34 34.5 35 35.5 36 Grams per kilogram
No data
Salinity worldwide normally varies between 34% and 37%; variations are attributable to atmospheric con- ditions above the water and to the volume of freshwater inflows. Figure 16.3 shows an image of global varia- tions in salinity (see aquarius.nasa.gov/). High annual precipitation over equatorial oceans leads to slightly lower than average salinity values in those regions of about 34.5‰ (note the lower values in the Pacific Ocean along the Intertropical Convergence Zone in Figure 16.3). In subtropical oceans—where evapora- tion rates are greatest because of the influence of hot, dry subtropical high-pressure cells—salinity is more concentrated. In these regions, salinity is presently increasing as rising temperatures lead to increased evaporation rates.
In general, oceans are lower in salinity near landmasses because of freshwater inputs. The term brackish applies to water that is less than 35% salts. Extreme examples include the Baltic Sea (north of Poland and Germany) and the Gulf of Bothnia (between Sweden and Finland), which average 10% or less salinity because of heavy freshwater runoff and low evaporation rates. In general, the high-latitude oceans have been freshening over the past decade with increased melting of glaciers and ice sheets, as mentioned in Chapter 6.
In contrast, the Sargasso Sea, within the North Atlantic subtropical gyre, averages 38‰ (Figure 16.3). The Persian Gulf has a salinity of 40‰ as a result of high
evaporation rates in a nearly enclosed basin. The term brine is applied to water that exceeds the average of 35‰ salinity. Deep pockets, or “brine lakes,” along the floor of the Red Sea and the Mediterranean Sea register up to a salty 225‰.
Physical Structure and Human Impacts
The basic physical structure of the ocean consists of three horizontal layers (Figure 16.4). In the surface layer, warmed by the Sun, mixing is driven by winds. In this mixing zone, which represents only 2% of the oceanic mass, variations in water temperature and solutes are blended rapidly. Below the mixing zone is the thermo- cline transition zone, a region more than 1 km deep that lacks the motion of the surface and has a gradient in temperature that decreases with depth. Friction at these depths dampens the effect of surface currents. In addi- tion, colder water temperatures at the thermocline transi- tion zone’s lower margin tend to inhibit any convective movements.
In the top two layers of the ocean, average tempera- ture, salinity, dissolved carbon dioxide, and dissolved oxygen all vary with increasing depth. In contrast, from a depth of 1–1.5 km to the ocean floor, temperature and salinity values are quite uniform. Temperatures in this deep cold zone are near 0°C, and the coldest water is generally along the ocean bottom. However, seawa- ter in the deep cold zone does not freeze because the
 Georeport 16.1 The Mediterranean Sea Is Getting Saltier
The Mediterranean Sea is warming at a faster rate than the oceans—notice the high salinity levels in Figure 16.3. increased salinity and temperatures are occurring in the deep layers, below 600 m in depth. Saltier conditions change the water
density and cause net outflows past the Strait of gibraltar, thus blocking natural mixing with the atlantic Ocean. as climate changes, warming is disrupting the natural mixing in large water bodies, including lakes, with adverse impacts on ecosystems and biota.


