Page 543 - Geosystems An Introduction to Physical Geography 4th Canadian Edition
P. 543
Chapter 16 Oceans, Coastal Systems, and Wind Processes 507
      Moments after the Tohoku quake, JMa issued a tsunami warning that we now know was an underestimation of the actual wave size. The quake contin- ued for over 2 minutes after the tsunami model calculations began, and during this time the tsunami energy increased. a corrected warning was issued, but not until 20 minutes after the quake and too late for evacuation.
nine minutes after the initial earth- quake, the Pacific Tsunami Warning Cen- ter (PTWC) issued tsunami warnings to the Pacific islands and continents around the Pacific basin. The tsunami warn-
ing process used by the PTWC begins when ocean-bottom sensors register a change in pressure associated with an ocean disturbance. Data are relayed to
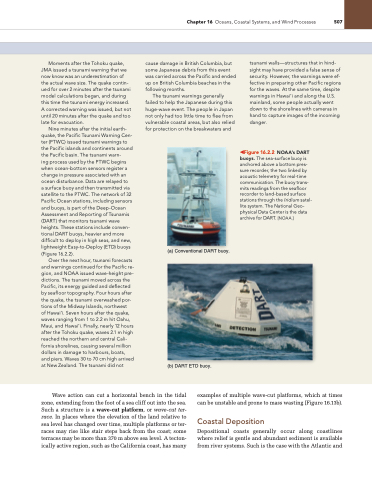
a surface buoy and then transmitted via satellite to the PTWC. The network of 32 Pacific Ocean stations, including sensors and buoys, is part of the Deep-Ocean assessment and reporting of Tsunamis (DarT) that monitors tsunami wave heights. These stations include conven- tional DarT buoys, heavier and more difficult to deploy in high seas, and new, lightweight easy-to-Deploy (eTD) buoys (Figure 16.2.2).
Over the next hour, tsunami forecasts and warnings continued for the Pacific re- gion, and nOaa issued wave-height pre- dictions. The tsunami moved across the Pacific, its energy guided and deflected by seafloor topography. Four hours after the quake, the tsunami overwashed por- tions of the Midway islands, northwest
of Hawai‘i. Seven hours after the quake, waves ranging from 1 to 2.2 m hit Oahu, Maui, and Hawai‘i. Finally, nearly 12 hours after the Tohoku quake, waves 2.1 m high reached the northern and central Cali- fornia shorelines, causing several million dollars in damage to harbours, boats, and piers. Waves 30 to 70 cm high arrived at new Zealand. The tsunami did not
cause damage in British Columbia, but some Japanese debris from this event was carried across the Pacific and ended up on British Columbia beaches in the following months.
The tsunami warnings generally failed to help the Japanese during this huge-wave event. The people in Japan not only had too little time to flee from vulnerable coastal areas, but also relied for protection on the breakwaters and
(a) Conventional DART buoy.
tsunami walls—structures that in hind- sight may have provided a false sense of security. However, the warnings were ef- fective in preparing other Pacific regions for the waves. at the same time, despite warnings in Hawai‘i and along the U.S. mainland, some people actually went down to the shorelines with cameras in hand to capture images of the incoming danger.
◀Figure 16.2.2 NOAA’s DArT buoys. The sea-surface buoy is anchored above a bottom pres- sure recorder, the two linked by acoustic telemetry for real-time communication. The buoy trans- mits readings from the seafloor recorder to land-based surface stations through the Iridium satel- lite system. The national geo- physical Data Center is the data archive for DarT. [nOaa.]
    (b) DART ETD buoy.
Wave action can cut a horizontal bench in the tidal zone, extending from the foot of a sea cliff out into the sea. Such a structure is a wave-cut platform, or wave-cut ter- race. In places where the elevation of the land relative to sea level has changed over time, multiple platforms or ter- races may rise like stair steps back from the coast; some terraces may be more than 370 m above sea level. A tecton- ically active region, such as the California coast, has many
examples of multiple wave-cut platforms, which at times can be unstable and prone to mass wasting (Figure 16.13b).
Coastal Deposition
Depositional coasts generally occur along coastlines where relief is gentle and abundant sediment is available from river systems. Such is the case with the Atlantic and


