Page 564 - Geosystems An Introduction to Physical Geography 4th Canadian Edition
P. 564
 528 part III The Earth–Atmosphere Interface
   TABLE AQS 16.1 Sediment Gains and Losses—High Hinterland Coast
 Gains
(103 m3·yr−1)
Losses
(103 m3·yr−1)
Longshore in 140 Rivers 230
Total nearshore gains 415
Longshore out 240 Dune accretion and overwash 135
Total nearshore losses 380
 Beach erosion
  0
  Beach accretion
  5
   Cliff erosion
  45
  Inlets
  0
   Offshore in
  0
  Offshore out
  35
 Gains (415 from Total nearshore gains and 0 from Offshore in) equal losses (380 to Total nearshore losses plus 35 to Offshore out); these values are in 103 m3 · yr−1.
TABLE AQS 16.2 Sediment Gains and Losses—Low Hinterland Coast
   Gains
(103 m3·yr−1)
Losses
(103 m3·yr−1)
Longshore in 120 Rivers 0
Total nearshore gains 315
Longshore out 90 Dune accretion and overwash 165
Total nearshore losses 470
 Beach erosion
  195
  Beach accretion
  0
   Cliff erosion
  0
  Inlets
  215
   Offshore in
  155
  Offshore out
  0
 Gains (315 from Total nearshore in and 155 from Offshore in) equal losses (470 to Total nearshore out plus 0 to Offshore out); these values are in 103 m3 · yr−1.
 [Tables by M.-L. Byrne and B. McCann.]
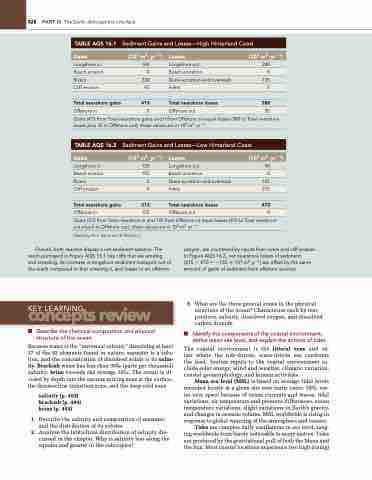
Overall, both reaches display a net sediment balance. The reach portrayed in Figure AQS 16.1 has cliffs that are eroding and receding. An increase in longshore sediment transport out of the reach compared to that entering it, and losses to an offshore
canyon, are countered by inputs from rivers and cliff erosion. In Figure AQS 16.2, net nearshore losses of sediment
(315 − 470 = −155 × 103 m3 · y−1) are offset by the same amount of gains of sediment from offshore sources.
 concepts review
KEy LEARnInG
 ■ Describe the chemical composition and physical structure of the ocean.
Because water is the “universal solvent,” dissolving at least 57 of the 92 elements found in nature, seawater is a solu- tion, and the concentration of dissolved solids is its salin- ity. Brackish water has less than 35‰ (parts per thousand) salinity; brine exceeds the average 35‰. The ocean is di- vided by depth into the narrow mixing zone at the surface, the thermocline transition zone, and the deep cold zone.
salinity (p. 493) brackish (p. 494) brine (p. 494)
1. Describe the salinity and composition of seawater, and the distribution of its solutes.
2. Analyze the latitudinal distribution of salinity dis- cussed in the chapter. Why is salinity less along the equator and greater in the subtropics?
3. What are the three general zones in the physical structure of the ocean? Characterise each by tem- perature, salinity, dissolved oxygen, and dissolved carbon dioxide.
■ Identify the components of the coastal environment, define mean sea level, and explain the actions of tides.
The coastal environment is the littoral zone and ex- ists where the tide-driven, wave-driven sea confronts the land. System inputs to the coastal environment in- clude solar energy, wind and weather, climatic variation, coastal geomorphology, and human activities.
Mean sea level (MSL) is based on average tidal levels recorded hourly at a given site over many years. MSL var- ies over space because of ocean currents and waves, tidal variations, air temperature and pressure differences, ocean temperature variations, slight variations in Earth’s gravity, and changes in oceanic volume. MSL worldwide is rising in response to global warming of the atmosphere and oceans.
Tides are complex daily oscillations in sea level, rang- ing worldwide from barely noticeable to many metres. Tides are produced by the gravitational pull of both the Moon and the Sun. Most coastal locations experience two high (rising)


