Page 563 - Geosystems An Introduction to Physical Geography 4th Canadian Edition
P. 563
   aQuantitativeSOLUTiOn
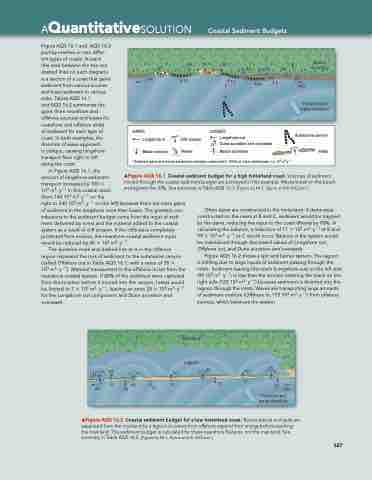
Figure AQS 16.1 and AQS 16.2 portray reaches on two differ- ent types of coasts. A reach (the area between the two red dashed lines on each diagram) is a section of a coast that gains sediment from various sources and loses sediment to various sinks. Tables AQS 16.1
and AQS 16.2 summarize the gains (from nearshore and offshore sources) and losses (to nearshore and offshore sinks) of sediment for each type of coast. In both examples, the direction of wave approach
is oblique, causing longshore transport from right to left along the coast.
In Figure AQS 16.1, the
amount of longshore sediment
transport increases by 100 ×
103 m3 · y−1 in this coastal reach
(from 140 103 m3 · y−1 on the
right to 240 103 m3 · y−1 on the left) because there are more gains of sediment in the longshore zone than losses. The greatest con- tributions to the sediment budget come from the input of sedi- ment delivered by rivers and the material added to the coastal system as a result of cliff erosion. If the cliffs were completely protected from erosion, the nearshore coastal sediment input would be reduced by 45 × 103 m3 · y−1.
The question mark and dashed line at A in the offshore region represent the loss of sediment to the submarine canyon (called Offshore out in Table AQS 16.1, with a value of 35 ×
103 m3 · y−1). Material transported to the offshore is lost from the nearshore coastal system. If 80% of the sediment were captured from this location before it moved into the canyon, losses would be limited to 7 × 10³ m3 · y−1, leaving an extra 28 × 103 m3 · y−1 for the Longshore out component and Dune accretion and overwash.
Coastal Sediment Budgets
    60 240 D
45
75 30
D
45C45 65
B
Beach accretion
    10 10205 ?
A
5 140
 Predominant wave direction
 GAINS
Longshore in
Cliff erosion
LOSSES Longshore out
D Dune accretion and overwash Beach accretion
Submarine canyon Inlets
Rivers
* Sediment gains and losses are annual averages, measured in 1000s of cubic metres/year; i.e. 103 m3•y–1
Beach erosion
 ▲Figure AQS 16.1 Coastal sediment budget for a high hinterland coast. Volumes of sediment moved through the coastal sediment budget are portrayed in this example. Waves break on the beach and against the cliffs. See summary in Table aQS 16.1. [Figure by M. L. Byrne and B. McCann.]
Often dams are constructed in the hinterland. If dams were constructed on the rivers at B and C, sediment would be trapped by the dams, reducing the input to the coast (Rivers) by 90%. In calculating the balance, a reduction of 11 × 103 m3 · y−1 at B and 99 × 103 m3 · y−1 at C would occur. Balance in the system would be maintained through decreased values of Longshore out, Offshore out, and Dune accretion and overwash.
Figure AQS 16.2 shows a spit and barrier system. The lagoon is infilling due to large inputs of sediment passing through the inlets. Sediment leaving this reach (Longshore out) on the left side (90 103 m3 · y−1) is less than the amount entering the reach on the right side (120 103 m3 · y−1) because sediment is diverted into the lagoon through the inlets. Waves are transporting large amounts of sediment onshore (Offshore in, 155 103 m3 · y−1) from offshore sources, which balances the system.
   Lagoon
25 70 45 70
100
90 D 30 45
25
Mainland
                  70
D
70
D
25 120
Predominant wave direction
          ▲Figure AQS 16.2 Coastal sediment budget for a low hinterland coast. Barrier islands and spits are separated from the mainland by a lagoon so waves from offshore expend their energy before reaching the mainland. This sediment budget is calculated for these nearshore features, not the mainland. See summary in Table aQS 16.2. [Figure by M. L. Byrne and B. McCann.]
527


