Page 611 - Geosystems An Introduction to Physical Geography 4th Canadian Edition
P. 611
Chapter 18 The Geography of Soils 575
   Among the many possible hues are the reds and yellows found in soils of New Brunswick and Prince Edward Island and in soils of the southeastern United States (high in iron oxides); the blacks of the prairie soils in parts of southern Alberta and Saskatchewan and por- tions of the U.S. grain-growing regions and Ukraine (richly organic); and white-to-pale hues found in soils containing silicates and aluminum oxides. However, colour can be deceptive: Soils of high humus content are often dark, yet clays of warm–temperate and tropi- cal regions with less than 3% organic content are some of the world’s blackest soils. A black hue can also be due to the presence of charcoal fragments rather than humic organics.
To standardize their descriptions, soil scientists describe a soil’s colour at various depths within the soil profile by comparing it with a Munsell Color Chart, developed by artist and teacher Albert Munsell in 1913 (Figure 18.3). These charts display 175 colours arranged by hue (the dominant spectral colour, such as red), value (the degree of darkness or lightness), and chroma (the purity and saturation of the colour, which increase with decreasing greyness). A Munsell notation identifies each colour by a name, so soil scientists can make worldwide comparisons of soil colour.
Soil Texture Texture refers to the mixture and propor- tions of different particle sizes and is perhaps a soil’s most permanent attribute. Individual mineral particles are soil separates. All particles smaller in diameter than
▲Figure 18.3 A Munsell Soil Color Chart page. A soil sample is viewed through holes in the page to match it with a colour on the chart. Hue, value, and chroma are the characteristics of colour assessed by this system. [Gretag Macbeth, Munsell Colour.]
2 mm, the size of very coarse sand, are considered part of the soil. Larger particles, such as pebbles, gravel, or cobbles, are not part of the soil. (Sands are graded from coarse to medium to fine, down to 0.05 mm; silt is finer, to 0.002 mm; and clay is finer still, at less than 0.002 mm.)
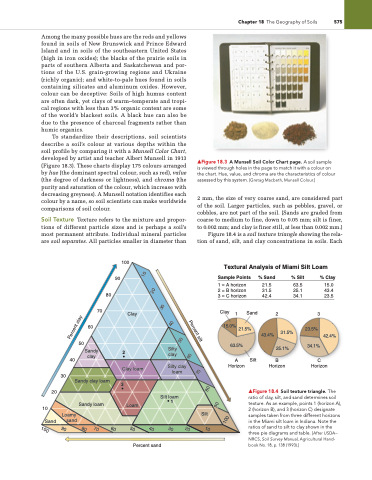
Figure 18.4 is a soil texture triangle showing the rela- tion of sand, silt, and clay concentrations in soils. Each
  100 90
Textural Analysis of Miami Silt Loam
          80 70
60
Sample Points
1 = A horizon 2 = B horizon 3 = C horizon
% Sand
21.5 31.5 42.4
% Silt
63.5 25.1 34.1
31.5%
% Clay
15.0 43.4 23.5
42.4%
      Clay
Clay1Sand 2 15.0% 21.5%
43.4%
3 23.5%
              50
40
Sandy clay loam
Sandy loam Sand sand
63.5% ABC
 Sandy clay
2
Silty clay
Silty clay loam
Silt loam
1
25.1% Horizon
34.1% Horizon
Silt
       Clay loam
3
Loam
Horizon
    30 20
▲Figure 18.4 Soil texture triangle. The ratio of clay, silt, and sand determines soil texture. As an example, points 1 (horizon A), 2 (horizon B), and 3 (horizon C) designate samples taken from three different horizons in the Miami silt loam in indiana. Note the ratios of sand to silt to clay shown in the three pie diagrams and table. [After USDA– NRCS, Soil Survey Manual, Agricultural Hand- book No. 18, p. 138 (1993).]
                      10
   Loamy
Silt
       Percent sand
Percent silt
Percent clay
90 100
70 80
50 60
30 40
10 20
90 100
70 80
50 60
30 40
10 20


