Page 669 - Geosystems An Introduction to Physical Geography 4th Canadian Edition
P. 669
Chapter 19 ecosystem essentials 633
      temperatures prolong the period of lake stratification, which interrupts normal lake turnover, isolating the cooler bot- tom waters for a longer time each year.
Wetland Ecosystems
Wetlands occupy a critical land–water interface, storing and cycling organic material and nutrients between terres- trial and aquatic ecosystems, filtering pollutants, anchoring soils and sediment against wave erosion, and providing sea- sonal reproductive habitat for migratory waterfowl, amphibians, and fish. The health of wetlands in the great lakes
is tied to lake levels, which determine wetland distribution, vegetation com- position, and ecological function. Fresh- water wetland ecosystems—primarily marshes, swamps, bogs, and fens—exist throughout the great lakes along lake shorelines and connecting river channels and floodplains. lower lake levels can effectively drain wetlands, causing habitat loss for many species.
Over two-thirds of great lakes wet- lands have been filled or drained for a variety of uses (agriculture, development, recreation) during this century, and those remaining are threatened by develop- ment, drainage, or pollution. The loss of these ecosystems affects water quality, since they dilute wastes from cities and industry, dissipate thermal pollution from power plants, and at the same time pro- vide municipal drinking water and irrigation water.
aquatic Ecosystems and Water Quality
like any aquatic ecosystem, the great lakes support a food web
of producers and consumers, and this web has suffered from human impacts over the years. native fish populations have declined from overfishing, introductions of non- native species, pollution from ex- cess nutrients, toxic contamination, and disruption of spawning habi- tats. Commercial fishing peaked in the 1880s, but it was not until water pollution peaked in the 1960s and early 1970s that fisheries declined to their lowest levels.
Toxic chemicals such as polychlori- nated biphenyls (PCBs) and DDT—both banned in north america in the 1970s— accumulate and persist in lake sedi- ments and organisms, and are subject to biological amplification as they move up the food chain. in the great lakes, scientists have reported PCBs in phyto- plankton, rainbow smelt, and lake trout, as well as higher in the food chain, as in eggshells of herring gulls.
in 1972, Canada and the United States signed the great lakes Water Quality agreement, which implemented strong pollution-control programs, run by governments working in concert with citizens, industries, and private organiza- tions. These efforts resulted in declining levels of PCBs and DDT in the lakes up until 1990, when rates of decline leveled off. Today, the fishery has mostly been restored. However, health advisories are occasionally issued concerning consump- tion of fish of certain species, sizes, and locales.
The lake Erie Dead Zone
about a third of the overall population in the great lakes Basin lives in the lake erie drainage basin, making it the major recipient of sewage effluent from treatment plants. as the shallowest and warmest of the great lakes, lake erie
was the first to show severe effects of eutrophication.
Over the years, dissolved oxygen levels in the lake dropped, resulting
in the formation of dead zones. algae flourished in these eutrophic conditions and coated the beaches, turning the
lake a greenish brown. in the 1950s and 1960s, the oily contaminated surface of the Cuyahoga river, flowing into lake erie through Cleveland, Ohio, caught fire several times. The 1969 fire finally spurred the public to demand action.
in the 1970s, environmental restric- tions reduced inputs of phosphorus into lake erie, eventually by about 90%. The dead zone steadily declined. How- ever, in the 1990s, scientists again iden- tified a significant lake erie dead zone, and in 2011, this zone expanded to its largest area ever recorded, attributed to severe spring storms that carried fertilizer runoff, primarily phosphorus, into the lake (see Figure gia 19.6).
The warmer water and generally lower wind speeds slowed the natural mixing; scientists expect that the agricultural and meteorological conditions that produced this bloom will continue in the future.
More information on great lakes ecosystems is at www.ec.gc.ca/great lakes/ and www.glerl.noaa.gov/.
  St. Mary's River 183.2 m
Lakes Michigan-
Lake St. Clair
Niagara Falls Lake
Lake Superior
406.3 m
610
St. Clair River
228.6 m Huron
143
St. Lawrence Lake Ontario
74.1 m
Lake
St. Francis
Lake St. Louis
GULF OF
ST. LAWRENCE
Huron
175.9 m
64.0 m 173.4 m
L. Erie
Detroit River
Niagara River
380 56 241 Distance (km)
281.3 m Michigan
97 359
0 m St. Lawrence River
244.4 m
124 45 84 53
563 km
Notebook
Ecosystems of the Great Lakes
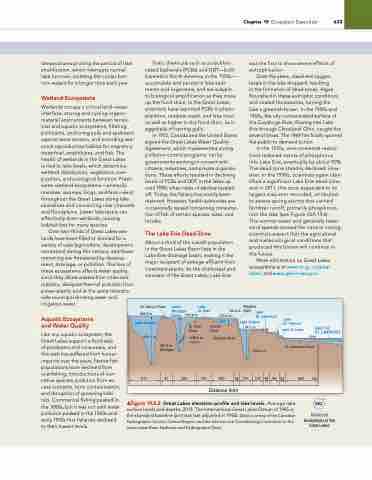
 ▲Figure 19.2.2 Great lakes elevation profile and lake levels. average lake surface levels and depths, 2013. The international great lakes Datum of 1985 is the standard baseline (and was last adjusted in 1992). [Data courtesy of the Canadian Hydrographic Service, Central region, and the international Coordinating Committee on the great lakes Basin Hydraulic and Hydrographic Data.]


