
Page 142 - The Principle of Economics
P. 142
144 PART THREE SUPPLY AND DEMAND II: MARKETS AND WELFARE
Table 7-2
THE DEMAND SCHEDULE FOR THE BUYERS IN TABLE 7-1
PRICE
More than $100 $80 to $100
$70 to $80
$50 to $70
$50 or less
BUYERS
None
John
John, Paul
John, Paul, George
John, Paul, George, Ringo
QUANTITY DEMANDED
0 1 2 3 4
Figure 7-1
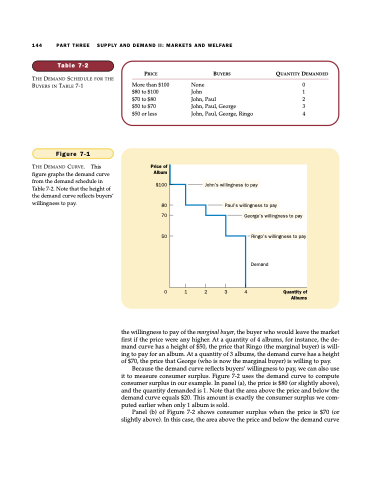
THE DEMAND CURVE. This Price of
John’s willingness to pay
Paul’s willingness to pay
George’s willingness to pay
Ringo’s willingness to pay
Demand
figure graphs the demand curve from the demand schedule in Table 7-2. Note that the height of the demand curve reflects buyers’ willingness to pay.
Album
$100
80 70
50
01234 Quantityof Albums
the willingness to pay of the marginal buyer, the buyer who would leave the market first if the price were any higher. At a quantity of 4 albums, for instance, the de- mand curve has a height of $50, the price that Ringo (the marginal buyer) is will- ing to pay for an album. At a quantity of 3 albums, the demand curve has a height of $70, the price that George (who is now the marginal buyer) is willing to pay.
Because the demand curve reflects buyers’ willingness to pay, we can also use it to measure consumer surplus. Figure 7-2 uses the demand curve to compute consumer surplus in our example. In panel (a), the price is $80 (or slightly above), and the quantity demanded is 1. Note that the area above the price and below the demand curve equals $20. This amount is exactly the consumer surplus we com- puted earlier when only 1 album is sold.
Panel (b) of Figure 7-2 shows consumer surplus when the price is $70 (or slightly above). In this case, the area above the price and below the demand curve
