
Page 143 - The Principle of Economics
P. 143
CHAPTER 7 CONSUMERS, PRODUCERS, AND THE EFFICIENCY OF MARKETS 145
Price of
$100
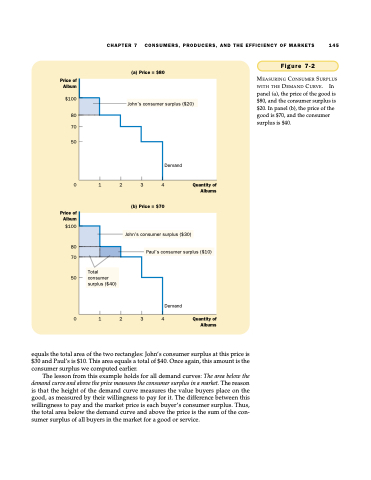
panel (a), the price of the good is $80, and the consumer surplus is $20. In panel (b), the price of the
(a) Price = $80
MEASURING CONSUMER SURPLUS Album WITH THE DEMAND CURVE. In
Figure 7-2
Demand
John’s consumer surplus ($20)
80 good is $70, and the consumer
70 50
0 1 2 3 4 Quantityof Albums
surplus is $40.
Price of Album
$100
80 70
50
(b) Price = $70
John’s consumer surplus ($30)
Paul’s consumer surplus ($10)
Total consumer surplus ($40)
Demand
0 1 2 3 4 Quantityof Albums
equals the total area of the two rectangles: John’s consumer surplus at this price is $30 and Paul’s is $10. This area equals a total of $40. Once again, this amount is the consumer surplus we computed earlier.
The lesson from this example holds for all demand curves: The area below the demand curve and above the price measures the consumer surplus in a market. The reason is that the height of the demand curve measures the value buyers place on the good, as measured by their willingness to pay for it. The difference between this willingness to pay and the market price is each buyer’s consumer surplus. Thus, the total area below the demand curve and above the price is the sum of the con- sumer surplus of all buyers in the market for a good or service.
