
Page 161 - The Principle of Economics
P. 161
CHAPTER 8 APPLICATION: THE COSTS OF TAXATION 163
Size of tax (T)
Supply
Demand
Tax revenue (T Q )
Quantity sold (Q)
Price
Price buyers pay
Price sellers receive
0 Quantity with tax
Figure 8-2
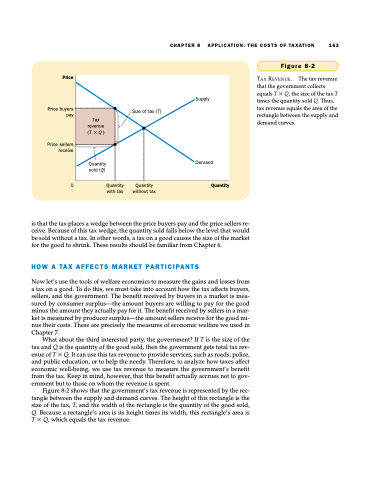
TAX REVENUE. The tax revenue that the government collects equals T Q, the size of the tax T times the quantity sold Q. Thus, tax revenue equals the area of the rectangle between the supply and demand curves.
Quantity without tax
Quantity
is that the tax places a wedge between the price buyers pay and the price sellers re- ceive. Because of this tax wedge, the quantity sold falls below the level that would be sold without a tax. In other words, a tax on a good causes the size of the market for the good to shrink. These results should be familiar from Chapter 6.
HOW A TAX AFFECTS MARKET PARTICIPANTS
Now let’s use the tools of welfare economics to measure the gains and losses from a tax on a good. To do this, we must take into account how the tax affects buyers, sellers, and the government. The benefit received by buyers in a market is mea- sured by consumer surplus—the amount buyers are willing to pay for the good minus the amount they actually pay for it. The benefit received by sellers in a mar- ket is measured by producer surplus—the amount sellers receive for the good mi- nus their costs. These are precisely the measures of economic welfare we used in Chapter 7.
What about the third interested party, the government? If T is the size of the tax and Q is the quantity of the good sold, then the government gets total tax rev- enue of T Q. It can use this tax revenue to provide services, such as roads, police, and public education, or to help the needy. Therefore, to analyze how taxes affect economic well-being, we use tax revenue to measure the government’s benefit from the tax. Keep in mind, however, that this benefit actually accrues not to gov- ernment but to those on whom the revenue is spent.
Figure 8-2 shows that the government’s tax revenue is represented by the rec- tangle between the supply and demand curves. The height of this rectangle is the size of the tax, T, and the width of the rectangle is the quantity of the good sold, Q. Because a rectangle’s area is its height times its width, this rectangle’s area is T Q, which equals the tax revenue.
