
Page 162 - The Principle of Economics
P. 162
164 PART THREE
SUPPLY AND DEMAND II: MARKETS AND WELFARE
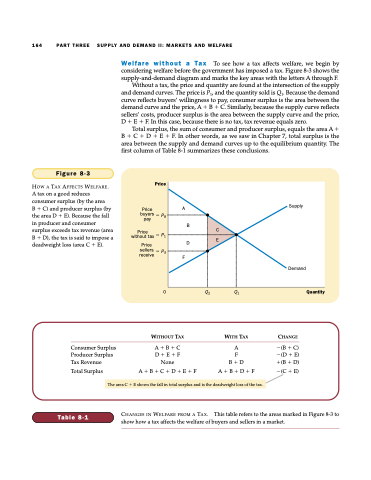
Welfare without a Tax To see how a tax affects welfare, we begin by considering welfare before the government has imposed a tax. Figure 8-3 shows the supply-and-demand diagram and marks the key areas with the letters A through F.
Without a tax, the price and quantity are found at the intersection of the supply and demand curves. The price is P1, and the quantity sold is Q1. Because the demand curve reflects buyers’ willingness to pay, consumer surplus is the area between the demand curve and the price, A B C. Similarly, because the supply curve reflects sellers’ costs, producer surplus is the area between the supply curve and the price, D E F. In this case, because there is no tax, tax revenue equals zero.
Total surplus, the sum of consumer and producer surplus, equals the area A B C D E F. In other words, as we saw in Chapter 7, total surplus is the area between the supply and demand curves up to the equilibrium quantity. The first column of Table 8-1 summarizes these conclusions.
Figure 8-3
HOW A TAX AFFECTS WELFARE. A tax on a good reduces consumer surplus (by the area
B C) and producer surplus (by the area D E). Because the fall in producer and consumer surplus exceeds tax revenue (area B D), the tax is said to impose a deadweight loss (area C E).
Price
Price buyers PB
A
Supply
Demand
B
D
C
E
F
pay Price
without tax P1
Price sellers PS receive
0 Q2 Q1
Quantity
Consumer Surplus Producer Surplus Tax Revenue
WITHOUT TAX
A B C D E F None
WITH TAX
A
F
B D
CHANGE
(B C) (D E) (B D)
(C E)
Total Surplus
Table 8-1
A B D F
A B C D E F
The area C E shows the fall in total surplus and is the deadweight loss of the tax.
CHANGES IN WELFARE FROM A TAX. This table refers to the areas marked in Figure 8-3 to
show how a tax affects the welfare of buyers and sellers in a market.
