
Page 269 - The Principle of Economics
P. 269
FROM THE PRODUCTION FUNCTION TO THE TOTAL-COST CURVE
The last three columns of Table 13-1 show Helen’s cost of producing cookies. In this example, the cost of Helen’s factory is $30 per hour, and the cost of a worker is $10 per hour. If she hires 1 worker, her total cost is $40. If she hires 2 workers, her total cost is $50, and so on. With this information, the table now shows how the number of workers Helen hires is related to the quantity of cookies she produces and to her total cost of production.
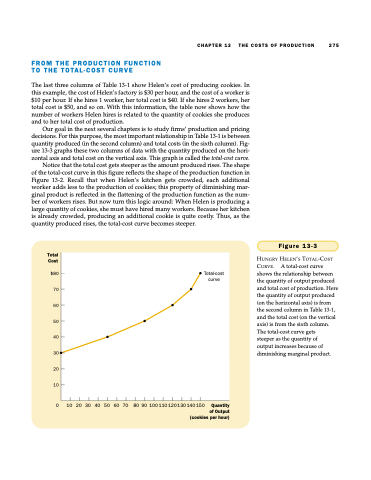
Our goal in the next several chapters is to study firms’ production and pricing decisions. For this purpose, the most important relationship in Table 13-1 is between quantity produced (in the second column) and total costs (in the sixth column). Fig- ure 13-3 graphs these two columns of data with the quantity produced on the hori- zontal axis and total cost on the vertical axis. This graph is called the total-cost curve.
Notice that the total cost gets steeper as the amount produced rises. The shape of the total-cost curve in this figure reflects the shape of the production function in Figure 13-2. Recall that when Helen’s kitchen gets crowded, each additional worker adds less to the production of cookies; this property of diminishing mar- ginal product is reflected in the flattening of the production function as the num- ber of workers rises. But now turn this logic around: When Helen is producing a large quantity of cookies, she must have hired many workers. Because her kitchen is already crowded, producing an additional cookie is quite costly. Thus, as the quantity produced rises, the total-cost curve becomes steeper.
CHAPTER 13 THE COSTS OF PRODUCTION 275
Total-cost cur ve
Total Cost
Figure 13-3
HUNGRY HELEN’S TOTAL-COST
CURVE. A total-cost curve
$80 shows the relationship between
70
60
50
40
the quantity of output produced and total cost of production. Here the quantity of output produced (on the horizontal axis) is from the second column in Table 13-1, and the total cost (on the vertical axis) is from the sixth column. The total-cost curve gets
steeper as the quantity of
output increases because of
30 diminishing marginal product.
20
10
0 10 20 30 40 50 60 70 80 90 100110120130140150 Quantity of Output (cookies per hour)
