
Page 270 - The Principle of Economics
P. 270
276 PART FIVE
FIRM BEHAVIOR AND THE ORGANIZATION OF INDUSTRY
QUICK QUIZ: If Farmer Jones plants no seeds on his farm, he gets no harvest. If he plants 1 bag of seeds, he gets 3 bushels of wheat. If he plants 2 bags, he gets 5 bushels. If he plants 3 bags, he gets 6 bushels. A bag of seeds costs $100, and seeds are his only cost. Use these data to graph the farmer’s production function and total-cost curve. Explain their shapes.
THE VARIOUS MEASURES OF COST
Our analysis of Hungry Helen’s Cookie Factory demonstrated how a firm’s total cost reflects its production function. From data on a firm’s total cost, we can derive several related measures of cost, which will turn out to be useful when we analyze production and pricing decisions in future chapters. To see how these related mea- sures are derived, we consider the example in Table 13-2. This table presents cost data on Helen’s neighbor: Thirsty Thelma’s Lemonade Stand.
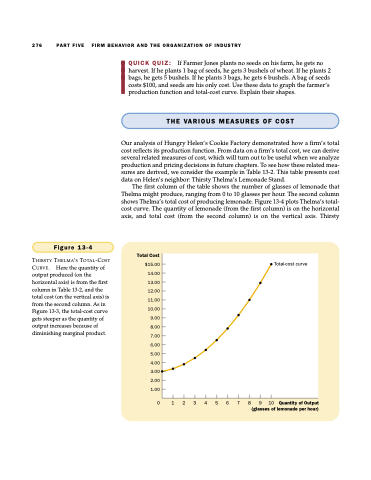
The first column of the table shows the number of glasses of lemonade that Thelma might produce, ranging from 0 to 10 glasses per hour. The second column shows Thelma’s total cost of producing lemonade. Figure 13-4 plots Thelma’s total- cost curve. The quantity of lemonade (from the first column) is on the horizontal axis, and total cost (from the second column) is on the vertical axis. Thirsty
Figure 13-4
THIRSTY THELMA’S TOTAL-COST CURVE. Here the quantity of output produced (on the horizontal axis) is from the first column in Table 13-2, and the total cost (on the vertical axis) is from the second column. As in Figure 13-3, the total-cost curve gets steeper as the quantity of output increases because of diminishing marginal product.
Total Cost
$15.00 14.00 13.00 12.00 11.00 10.00
9.00 8.00 7 .00 6.00 5.00 4.00 3.00 2.00 1.00
0 1 2 3
Total-cost curve
4 5 6
7 8
9 10 QuantityofOutput (glasses of lemonade per hour)
