
Page 276 - The Principle of Economics
P. 276
282
PART FIVE FIRM BEHAVIOR AND THE ORGANIZATION OF INDUSTRY
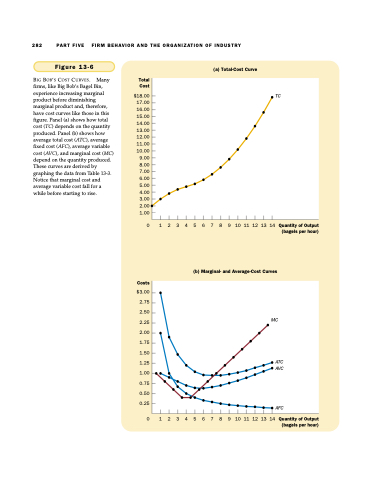
BIG BOB’S COST CURVES. Many firms, like Big Bob’s Bagel Bin, experience increasing marginal product before diminishing marginal product and, therefore, have cost curves like those in this figure. Panel (a) shows how total cost (TC) depends on the quantity produced. Panel (b) shows how average total cost (ATC), average fixed cost (AFC), average variable cost (AVC), and marginal cost (MC) depend on the quantity produced. These curves are derived by graphing the data from Table 13-3. Notice that marginal cost and average variable cost fall for a while before starting to rise.
TC
MC
ATC AVC
AFC
Figure 13-6
(a) Total-Cost Curve
Total Cost
$18.00 17.00 16.00 15.00 14.00 13.00 12.00 11.00 10.00
9.00 8.00 7 .00 6.00 5.00 4.00 3.00 2.00 1.00
Costs
$3.00 2.75 2.50 2.25 2.00 1.75 1.50 1.25 1.00 0.75 0.50 0.25
0 1 2 3 4 5 6 7 8 9 1011121314QuantityofOutput (bagels per hour)
(b) Marginal- and Average-Cost Curves
0 1 2 3 4 5 6 7 8 9 1011121314QuantityofOutput (bagels per hour)
