
Page 277 - The Principle of Economics
P. 277
QUICK QUIZ: Suppose Honda’s total cost of producing 4 cars is $225,000 and its total cost of producing 5 cars is $250,000. What is the average total cost of producing 5 cars? What is the marginal cost of the fifth car? N Draw the marginal-cost curve and the average-total-cost curve for a typical firm, and explain why these curves cross where they do.
COSTS IN THE SHORT RUN AND IN THE LONG RUN
We noted at the beginning of this chapter that a firm’s costs might depend on the time horizon being examined. Let’s examine more precisely why this might be the case.
THE RELATIONSHIP BETWEEN SHORT-RUN AND LONG-RUN AVERAGE TOTAL COST
For many firms, the division of total costs between fixed and variable costs de- pends on the time horizon. Consider, for instance, a car manufacturer, such as Ford Motor Company. Over a period of only a few months, Ford cannot adjust the num- ber or sizes of its car factories. The only way it can produce additional cars is to hire more workers at the factories it already has. The cost of these factories is, therefore, a fixed cost in the short run. By contrast, over a period of several years, Ford can expand the size of its factories, build new factories, or close old ones. Thus, the cost of its factories is a variable cost in the long run.
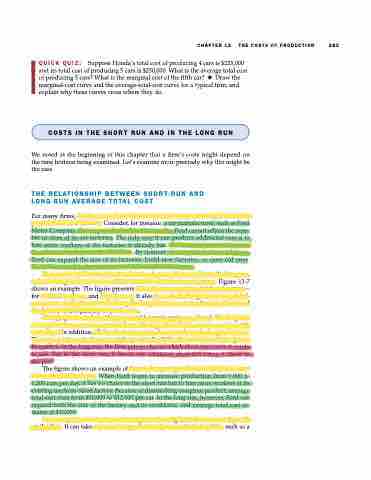
Because many decisions are fixed in the short run but variable in the long run, a firm’s long-run cost curves differ from its short-run cost curves. Figure 13-7 shows an example. The figure presents three short-run average-total-cost curves— for a small, medium, and large factory. It also presents the long-run average-total- cost curve. As the firm moves along the long-run curve, it is adjusting the size of the factory to the quantity of production.
This graph shows how short-run and long-run costs are related. The long-run average-total-cost curve is a much flatter U-shape than the short-run average-total- cost curve. In addition, all the short-run curves lie on or above the long-run curve. These properties arise because of the greater flexibility firms have in the long run. In essence, in the long run, the firm gets to choose which short-run curve it wants to use. But in the short run, it has to use whatever short-run curve it chose in the past.
The figure shows an example of how a change in production alters costs over different time horizons. When Ford wants to increase production from 1,000 to 1,200 cars per day, it has no choice in the short run but to hire more workers at its existing medium-sized factory. Because of diminishing marginal product, average total cost rises from $10,000 to $12,000 per car. In the long run, however, Ford can expand both the size of the factory and its workforce, and average total cost re- mains at $10,000.
How long does it take for a firm to get to the long run? The answer depends on the firm. It can take a year or longer for a major manufacturing firm, such as a
CHAPTER 13 THE COSTS OF PRODUCTION 283
