
Page 289 - The Principle of Economics
P. 289
TOTAL
MARGINAL
REVENUE (MR ∆TR/∆Q)
MARGINAL
COST
(MC ∆TC/∆Q)
REVENUE (TR)
TOTAL COST (TC)
PROFIT (TR TC)
CHAPTER 14
FIRMS IN COMPETITIVE MARKETS 295
QUANTITY
(IN GALLONS)
(Q)
0 $0 $3 $3
1651 2 12 8 4 3 18 12 6 4 24 17 7 5 30 23 7 6 36 30 6 7 42 38 4 8 48 47 1
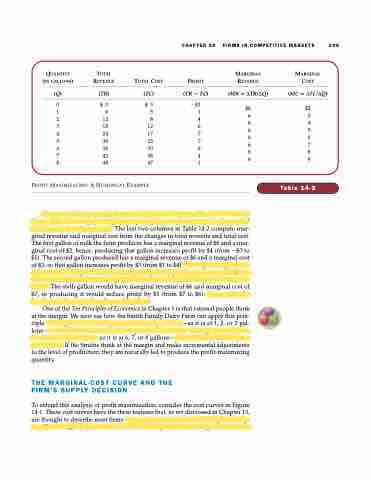
PROFIT MAXIMIZATION: A NUMERICAL EXAMPLE
There is another way to look at the Smith Farm’s decision: The Smiths can find the profit-maximizing quantity by comparing the marginal revenue and marginal cost from each unit produced. The last two columns in Table 14-2 compute mar- ginal revenue and marginal cost from the changes in total revenue and total cost. The first gallon of milk the farm produces has a marginal revenue of $6 and a mar- ginal cost of $2; hence, producing that gallon increases profit by $4 (from $3 to $1). The second gallon produced has a marginal revenue of $6 and a marginal cost of $3, so that gallon increases profit by $3 (from $1 to $4). As long as marginal rev- enue exceeds marginal cost, increasing the quantity produced raises profit. Once the Smith Farm has reached 5 gallons of milk, however, the situation is very dif- ferent. The sixth gallon would have marginal revenue of $6 and marginal cost of $7, so producing it would reduce profit by $1 (from $7 to $6). As a result, the Smiths would not produce beyond 5 gallons.
One of the Ten Principles of Economics in Chapter 1 is that rational people think at the margin. We now see how the Smith Family Dairy Farm can apply this prin- ciple. If marginal revenue is greater than marginal cost—as it is at 1, 2, or 3 gal- lons—the Smiths should increase the production of milk. If marginal revenue is less than marginal cost—as it is at 6, 7, or 8 gallons—the Smiths should decrease production. If the Smiths think at the margin and make incremental adjustments to the level of production, they are naturally led to produce the profit-maximizing quantity.
THE MARGINAL-COST CURVE AND THE FIRM’S SUPPLY DECISION
To extend this analysis of profit maximization, consider the cost curves in Figure 14-1. These cost curves have the three features that, as we discussed in Chapter 13, are thought to describe most firms: The marginal-cost curve (MC) is upward slop- ing. The average-total-cost curve (ATC) is U-shaped. And the marginal-cost curve
$6 63 64 65 66 67 68 69
Table 14-2
$2
