
Page 290 - The Principle of Economics
P. 290
296 PART FIVE FIRM BEHAVIOR AND THE ORGANIZATION OF INDUSTRY
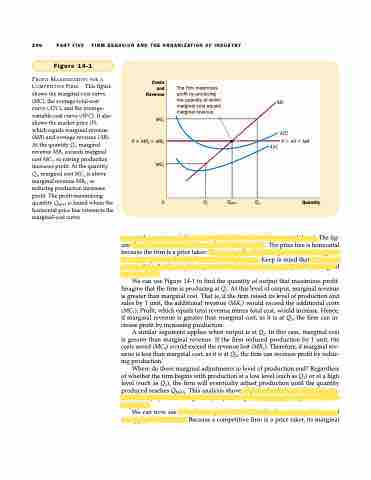
Figure 14-1
PROFIT MAXIMIZATION FOR A
COMPETITIVE FIRM. This figure
shows the marginal-cost curve Revenue (MC), the average-total-cost
curve (ATC), and the average-
variable-cost curve (AVC). It also
shows the market price (P),
which equals marginal revenue
(MR) and average revenue (AR).
At the quantity Q1, marginal
revenue MR1 exceeds marginal
cost MC1, so raising production
increases profit. At the quantity
Q2, marginal cost MC2 is above
marginal revenue MR2, so
reducing production increases
profit. The profit-maximizing
quantity QMAX is found where the
horizontal price line intersects the
marginal-cost curve.
The firm maximizes profit by producing the quantity at which marginal cost equals marginal revenue.
MC
ATC
P = AR = MR AVC
Costs and
MC2
P = MR1 = MR2
MC1
0 Q1
QMAX Q2
Quantity
crosses the average-total-cost curve at the minimum of average total cost. The fig- ure also shows a horizontal line at the market price (P). The price line is horizontal because the firm is a price taker: The price of the firm’s output is the same regard- less of the quantity that the firm decides to produce. Keep in mind that, for a com- petitive firm, the firm’s price equals both its average revenue (AR) and its marginal revenue (MR).
We can use Figure 14-1 to find the quantity of output that maximizes profit. Imagine that the firm is producing at Q1. At this level of output, marginal revenue is greater than marginal cost. That is, if the firm raised its level of production and sales by 1 unit, the additional revenue (MR1) would exceed the additional costs (MC1). Profit, which equals total revenue minus total cost, would increase. Hence, if marginal revenue is greater than marginal cost, as it is at Q1, the firm can in- crease profit by increasing production.
A similar argument applies when output is at Q2. In this case, marginal cost is greater than marginal revenue. If the firm reduced production by 1 unit, the costs saved (MC2) would exceed the revenue lost (MR2). Therefore, if marginal rev- enue is less than marginal cost, as it is at Q2, the firm can increase profit by reduc- ing production.
Where do these marginal adjustments to level of production end? Regardless of whether the firm begins with production at a low level (such as Q1) or at a high level (such as Q2), the firm will eventually adjust production until the quantity produced reaches QMAX. This analysis shows a general rule for profit maximiza- tion: At the profit-maximizing level of output, marginal revenue and marginal cost are ex- actly equal.
We can now see how the competitive firm decides the quantity of its good to supply to the market. Because a competitive firm is a price taker, its marginal
