
Page 42 - The Principle of Economics
P. 42
40 PART ONE
INTRODUCTION
graphically represent the middle column of Table 2A-1. When the points that rep- resent these entries from the table—(5 novels, $10), (9 novels, $9), and so on—are connected, they form a line. This line, pictured in Figure 2A-3, is known as Emma’s demand curve for novels; it tells us how many novels Emma purchases at any given price. The demand curve is downward sloping, indicating that a higher price reduces the quantity of novels demanded. Because the quantity of novels demanded and the price move in opposite directions, we say that the two vari- ables are negatively related. (Conversely, when two variables move in the same di- rection, the curve relating them is upward sloping, and we say the variables are positively related.)
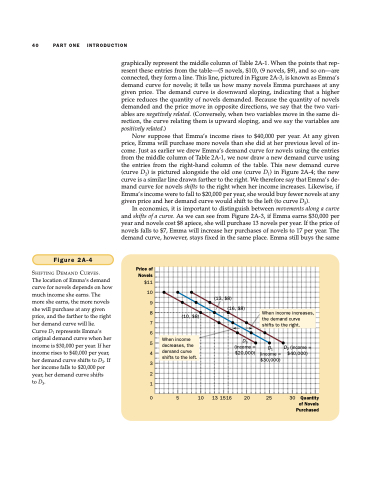
Now suppose that Emma’s income rises to $40,000 per year. At any given price, Emma will purchase more novels than she did at her previous level of in- come. Just as earlier we drew Emma’s demand curve for novels using the entries from the middle column of Table 2A-1, we now draw a new demand curve using the entries from the right-hand column of the table. This new demand curve (curve D2) is pictured alongside the old one (curve D1) in Figure 2A-4; the new curve is a similar line drawn farther to the right. We therefore say that Emma’s de- mand curve for novels shifts to the right when her income increases. Likewise, if Emma’s income were to fall to $20,000 per year, she would buy fewer novels at any given price and her demand curve would shift to the left (to curve D3).
In economics, it is important to distinguish between movements along a curve and shifts of a curve. As we can see from Figure 2A-3, if Emma earns $30,000 per year and novels cost $8 apiece, she will purchase 13 novels per year. If the price of novels falls to $7, Emma will increase her purchases of novels to 17 per year. The demand curve, however, stays fixed in the same place. Emma still buys the same
Figure 2A-4
(10,
$8)
(13,
$8)
(16,
$
)
(inc
When income increases, the demand curve
shifts to the right.
When income decreases, the demand curve shifts to the left.
D
ome
=
(incom 30,0
$
e=
00
)
D
2
(income =
$4
)
SHIFTING DEMAND CURVES.
The location of Emma’s demand
curve for novels depends on how
much income she earns. The
more she earns, the more novels 9 she will purchase at any given
price, and the farther to the right
her demand curve will lie.
Curve D1 represents Emma’s
original demand curve when her
income is $30,000 per year. If her
income rises to $40,000 per year,
her demand curve shifts to D2. If
her income falls to $20,000 per
year, her demand curve shifts
to D3. 1
0 5
8
Price of Novels $11
10
8
7
6
5
4 $20,000) 3
2
0,000
30 Quantity of Novels Purchased
10 13 1516 20 25
3
D1
