
Page 41 - The Principle of Economics
P. 41
CHAPTER 2 THINKING LIKE AN ECONOMIST 39
PRICE
$10 9 8 7 6 5
$20,000
2 novels
6 10 14 18 22
Demand curve, D3
INCOME $30,000
5 novels
9 13 17 21 25
Demand curve, D1
Table 2A-1
NOVELS PURCHASED BY EMMA. $40,000 This table shows the number of
8 novels 12
16 20 24 28
Demand curve, D2
novels Emma buys at various incomes and prices. For any given level of income, the data on price and quantity demanded can be graphed to produce Emma’s demand curve for novels, as in Figure 2A-3.
(5, $10)
(9,
$9)
(13, $8)
(17, $7)
(
21, $6)
(
Demand,
D
Price of Novels $11
10 9 8 7 6 5 4 3 2 1
0 5
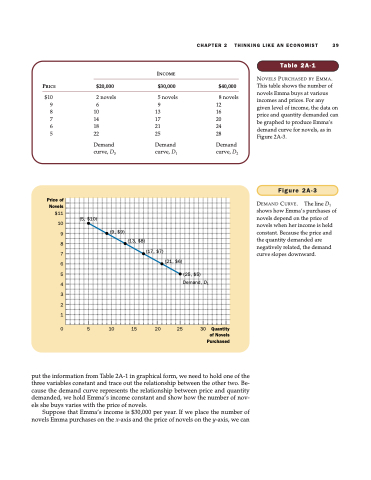
Figure 2A-3
DEMAND CURVE. The line D1 shows how Emma’s purchases of novels depend on the price of novels when her income is held constant. Because the price and the quantity demanded are negatively related, the demand curve slopes downward.
25, $5)
1
10 15
20 25
30 Quantity of Novels Purchased
put the information from Table 2A-1 in graphical form, we need to hold one of the three variables constant and trace out the relationship between the other two. Be- cause the demand curve represents the relationship between price and quantity demanded, we hold Emma’s income constant and show how the number of nov- els she buys varies with the price of novels.
Suppose that Emma’s income is $30,000 per year. If we place the number of novels Emma purchases on the x-axis and the price of novels on the y-axis, we can
