
Page 431 - The Principle of Economics
P. 431
N What problems arise in measuring the amount of inequality? N How often do people move among income classes?
These measurement questions are the natural starting point from which to discuss public policies aimed at changing the distribution of income.
U.S. INCOME INEQUALITY
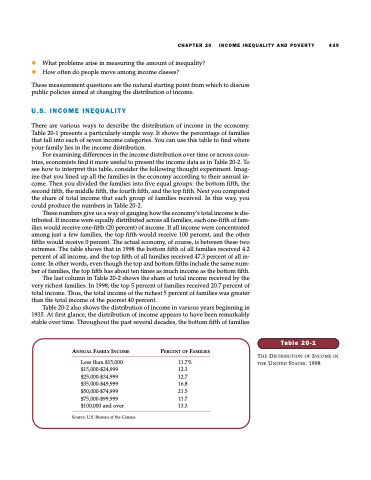
There are various ways to describe the distribution of income in the economy. Table 20-1 presents a particularly simple way. It shows the percentage of families that fall into each of seven income categories. You can use this table to find where your family lies in the income distribution.
For examining differences in the income distribution over time or across coun- tries, economists find it more useful to present the income data as in Table 20-2. To see how to interpret this table, consider the following thought experiment. Imag- ine that you lined up all the families in the economy according to their annual in- come. Then you divided the families into five equal groups: the bottom fifth, the second fifth, the middle fifth, the fourth fifth, and the top fifth. Next you computed the share of total income that each group of families received. In this way, you could produce the numbers in Table 20-2.
These numbers give us a way of gauging how the economy’s total income is dis- tributed. If income were equally distributed across all families, each one-fifth of fam- ilies would receive one-fifth (20 percent) of income. If all income were concentrated among just a few families, the top fifth would receive 100 percent, and the other fifths would receive 0 percent. The actual economy, of course, is between these two extremes. The table shows that in 1998 the bottom fifth of all families received 4.2 percent of all income, and the top fifth of all families received 47.3 percent of all in- come. In other words, even though the top and bottom fifths include the same num- ber of families, the top fifth has about ten times as much income as the bottom fifth.
The last column in Table 20-2 shows the share of total income received by the very richest families. In 1998, the top 5 percent of families received 20.7 percent of total income. Thus, the total income of the richest 5 percent of families was greater than the total income of the poorest 40 percent.
Table 20-2 also shows the distribution of income in various years beginning in 1935. At first glance, the distribution of income appears to have been remarkably stable over time. Throughout the past several decades, the bottom fifth of families
CHAPTER 20 INCOME INEQUALITY AND POVERTY 439
ANNUAL FAMILY INCOME
Less than $15,000 $15,000-$24,999 $25,000-$34,999 $35,000-$49,999 $50,000-$74,999 $75,000-$99,999 $100,000 and over
Source: U.S. Bureau of the Census.
PERCENT OF FAMILIES
11.7% 12.3 12.7 16.8 21.5 11.7 13.3
Table 20-1
THE DISTRIBUTION OF INCOME IN THE UNITED STATES: 1998
