
Page 433 - The Principle of Economics
P. 433
As this example shows, there are social as well as economic determinants of the distribution of income. Moreover, the simplistic view that “income inequal- ity is bad” can be misleading. Increasing the opportunities available to women was surely a good change for society, even if one effect was greater inequality in family incomes. When evaluating any change in the distribution of income, pol- icymakers must look at the reasons for that change before deciding whether it presents a problem for society.
CASE STUDY INCOME INEQUALITY AROUND THE WORLD
How does the amount of income inequality in the United States compare to that in other countries? This question is interesting, but answering it is problematic. For many countries, data are not available. Even when they are, not every coun- try in the world collects data in the same way; for example, some countries col- lect data on individual incomes, whereas other countries collect data on family incomes. As a result, whenever we find a difference between two countries, we can never be sure whether it reflects a true difference in the economies or merely a difference in the way data are collected.
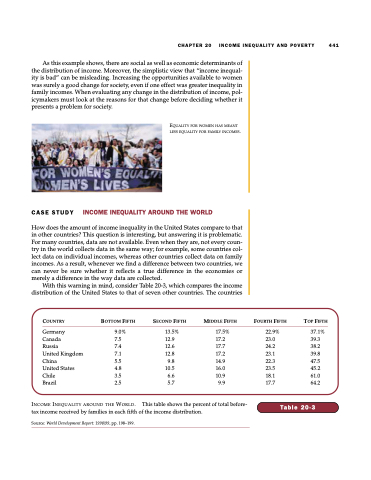
With this warning in mind, consider Table 20-3, which compares the income distribution of the United States to that of seven other countries. The countries
CHAPTER 20 INCOME INEQUALITY AND POVERTY 441
EQUALITY FOR WOMEN HAS MEANT LESS EQUALITY FOR FAMILY INCOMES.
COUNTRY
Germany Canada
Russia
United Kingdom China
United States Chile
Brazil
BOTTOM FIFTH
9.0% 7.5 7.4 7.1 5.5 4.8 3.5 2.5
SECOND FIFTH
13.5% 12.9 12.6 12.8
9.8 10.5 6.6 5.7
MIDDLE FIFTH
17.5% 17.2 17.7 17.2 14.9 16.0 10.9
9.9
FOURTH FIFTH
22.9% 23.0 24.2 23.1 22.3 23.5 18.1 17.7
INCOME INEQUALITY AROUND THE WORLD.
tax income received by families in each fifth of the income distribution.
Source: World Development Report: 1998/99, pp. 198–199.
TOP FIFTH
37.1% 39.3 38.2 39.8 47.5 45.2 61.0 64.2
Table 20-3
This table shows the percent of total before-
