
Page 45 - The Principle of Economics
P. 45
variables constant, we know that changes in the price of novels cause changes in the quantity Emma demands. Remember, however, that our demand curve came from a hypothetical example. When graphing data from the real world, it is often more difficult to establish how one variable affects another.
The first problem is that it is difficult to hold everything else constant when measuring how one variable affects another. If we are not able to hold variables constant, we might decide that one variable on our graph is causing changes in the other variable when actually those changes are caused by a third omitted variable not pictured on the graph. Even if we have identified the correct two variables to look at, we might run into a second problem—reverse causality. In other words, we might decide that A causes B when in fact B causes A. The omitted-variable and reverse-causality traps require us to proceed with caution when using graphs to draw conclusions about causes and effects.
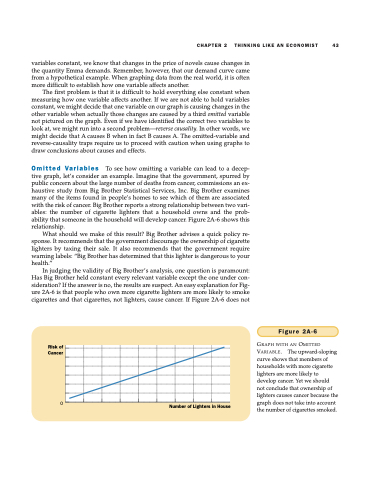
Omitted Variables To see how omitting a variable can lead to a decep- tive graph, let’s consider an example. Imagine that the government, spurred by public concern about the large number of deaths from cancer, commissions an ex- haustive study from Big Brother Statistical Services, Inc. Big Brother examines many of the items found in people’s homes to see which of them are associated with the risk of cancer. Big Brother reports a strong relationship between two vari- ables: the number of cigarette lighters that a household owns and the prob- ability that someone in the household will develop cancer. Figure 2A-6 shows this relationship.
What should we make of this result? Big Brother advises a quick policy re- sponse. It recommends that the government discourage the ownership of cigarette lighters by taxing their sale. It also recommends that the government require warning labels: “Big Brother has determined that this lighter is dangerous to your health.”
In judging the validity of Big Brother’s analysis, one question is paramount: Has Big Brother held constant every relevant variable except the one under con- sideration? If the answer is no, the results are suspect. An easy explanation for Fig- ure 2A-6 is that people who own more cigarette lighters are more likely to smoke cigarettes and that cigarettes, not lighters, cause cancer. If Figure 2A-6 does not
CHAPTER 2 THINKING LIKE AN ECONOMIST 43
Risk of Cancer
0 Number of Lighters in House
Figure 2A-6
GRAPH WITH AN OMITTED VARIABLE. The upward-sloping curve shows that members of households with more cigarette lighters are more likely to develop cancer. Yet we should not conclude that ownership of lighters causes cancer because the graph does not take into account the number of cigarettes smoked.
