
Page 46 - The Principle of Economics
P. 46
44 PART ONE
INTRODUCTION
hold constant the amount of smoking, it does not tell us the true effect of owning a cigarette lighter.
This story illustrates an important principle: When you see a graph being used to support an argument about cause and effect, it is important to ask whether the movements of an omitted variable could explain the results you see.
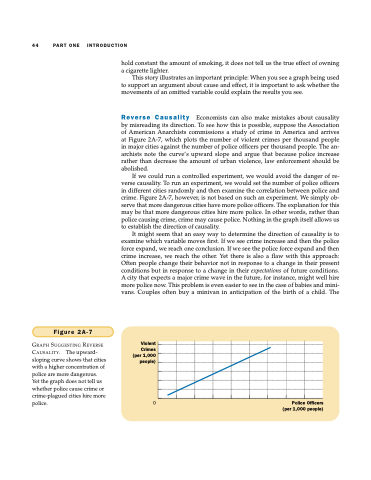
Reverse Causality Economists can also make mistakes about causality by misreading its direction. To see how this is possible, suppose the Association of American Anarchists commissions a study of crime in America and arrives at Figure 2A-7, which plots the number of violent crimes per thousand people in major cities against the number of police officers per thousand people. The an- archists note the curve’s upward slope and argue that because police increase rather than decrease the amount of urban violence, law enforcement should be abolished.
If we could run a controlled experiment, we would avoid the danger of re- verse causality. To run an experiment, we would set the number of police officers in different cities randomly and then examine the correlation between police and crime. Figure 2A-7, however, is not based on such an experiment. We simply ob- serve that more dangerous cities have more police officers. The explanation for this may be that more dangerous cities hire more police. In other words, rather than police causing crime, crime may cause police. Nothing in the graph itself allows us to establish the direction of causality.
It might seem that an easy way to determine the direction of causality is to examine which variable moves first. If we see crime increase and then the police force expand, we reach one conclusion. If we see the police force expand and then crime increase, we reach the other. Yet there is also a flaw with this approach: Often people change their behavior not in response to a change in their present conditions but in response to a change in their expectations of future conditions. A city that expects a major crime wave in the future, for instance, might well hire more police now. This problem is even easier to see in the case of babies and mini- vans. Couples often buy a minivan in anticipation of the birth of a child. The
Figure 2A-7
GRAPH SUGGESTING REVERSE CAUSALITY. The upward- sloping curve shows that cities with a higher concentration of police are more dangerous.
Violent
Crimes (per 1,000 people)
Yet the graph does not tell us
whether police cause crime or
crime-plagued cities hire more
police. 0
Police Officers (per 1,000 people)
