
Page 455 - The Principle of Economics
P. 455
CHAPTER 21
THE THEORY OF CONSUMER CHOICE 465
PINTS OF PEPSI
0
50
100
150
200
250
300
350
400
450
500
NUMBER
OF PIZZAS
100
90
80
70
60
50
40
30
20
10
0
SPENDING
ON PEPSI
$
SPENDING
ON PIZZA
$1,000 900 800 700 600 500 400 300 200 100 0
TOTAL
SPENDING
$1,000 1,000 1,000 1,000 1,000 1,000 1,000 1,000 1,000 1,000 1,000
Table 21-1
THE CONSUMER’S OPPORTUNITIES. This table shows what the consumer can afford if his income is $1,000, the price of Pepsi is $2, and the price of pizza is $10.
0 100 200 300 400 500 600 700 800 900 1,000
B
C
Consumer’s budget constraint
A
Quantity of Pepsi
500
250
0 50 100
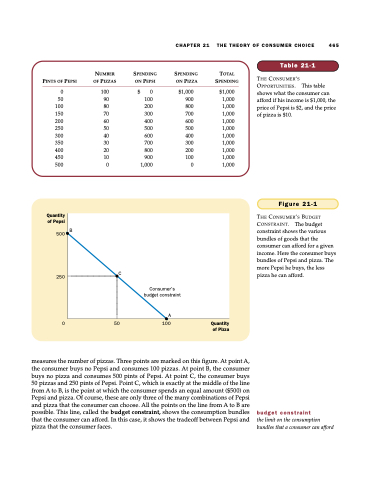
Figure 21-1
THE CONSUMER’S BUDGET CONSTRAINT. The budget constraint shows the various bundles of goods that the consumer can afford for a given income. Here the consumer buys bundles of Pepsi and pizza. The more Pepsi he buys, the less pizza he can afford.
Quantity of Pizza
measures the number of pizzas. Three points are marked on this figure. At point A, the consumer buys no Pepsi and consumes 100 pizzas. At point B, the consumer buys no pizza and consumes 500 pints of Pepsi. At point C, the consumer buys 50 pizzas and 250 pints of Pepsi. Point C, which is exactly at the middle of the line from A to B, is the point at which the consumer spends an equal amount ($500) on Pepsi and pizza. Of course, these are only three of the many combinations of Pepsi and pizza that the consumer can choose. All the points on the line from A to B are possible. This line, called the budget constraint, shows the consumption bundles that the consumer can afford. In this case, it shows the tradeoff between Pepsi and pizza that the consumer faces.
budget constraint
the limit on the consumption bundles that a consumer can afford
