
Page 457 - The Principle of Economics
P. 457
CHAPTER 21 THE THEORY OF CONSUMER CHOICE 467
C
BD
MRS
1
I2
A Indifference curve, I1
Quantity of Pepsi
Figure 21-2
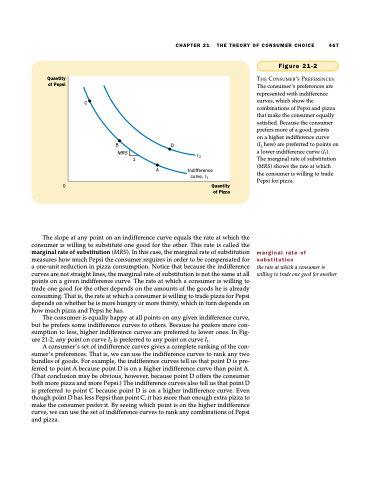
THE CONSUMER’S PREFERENCES. The consumer’s preferences are represented with indifference curves, which show the combinations of Pepsi and pizza that make the consumer equally satisfied. Because the consumer prefers more of a good, points
on a higher indifference curve
(I2 here) are preferred to points on a lower indifference curve (I1). The marginal rate of substitution (MRS) shows the rate at which the consumer is willing to trade Pepsi for pizza.
0 Quantity of Pizza
The slope at any point on an indifference curve equals the rate at which the consumer is willing to substitute one good for the other. This rate is called the marginal rate of substitution (MRS). In this case, the marginal rate of substitution measures how much Pepsi the consumer requires in order to be compensated for a one-unit reduction in pizza consumption. Notice that because the indifference curves are not straight lines, the marginal rate of substitution is not the same at all points on a given indifference curve. The rate at which a consumer is willing to trade one good for the other depends on the amounts of the goods he is already consuming. That is, the rate at which a consumer is willing to trade pizza for Pepsi depends on whether he is more hungry or more thirsty, which in turn depends on how much pizza and Pepsi he has.
The consumer is equally happy at all points on any given indifference curve, but he prefers some indifference curves to others. Because he prefers more con- sumption to less, higher indifference curves are preferred to lower ones. In Fig- ure 21-2, any point on curve I2 is preferred to any point on curve I1.
A consumer’s set of indifference curves gives a complete ranking of the con- sumer’s preferences. That is, we can use the indifference curves to rank any two bundles of goods. For example, the indifference curves tell us that point D is pre- ferred to point A because point D is on a higher indifference curve than point A. (That conclusion may be obvious, however, because point D offers the consumer both more pizza and more Pepsi.) The indifference curves also tell us that point D is preferred to point C because point D is on a higher indifference curve. Even though point D has less Pepsi than point C, it has more than enough extra pizza to make the consumer prefer it. By seeing which point is on the higher indifference curve, we can use the set of indifference curves to rank any combinations of Pepsi and pizza.
marginal rate of substitution
the rate at which a consumer is willing to trade one good for another
