
Page 459 - The Principle of Economics
P. 459
CHAPTER 21 THE THEORY OF CONSUMER CHOICE 469
Figure 21-4
Quantity BOWED INDIFFERENCE CURVES.
MRS = 6
1
A
MRS = 1
B
1
Indifference curve
of Pepsi
14
8
4 3
0 23 67 Quantity of Pizza
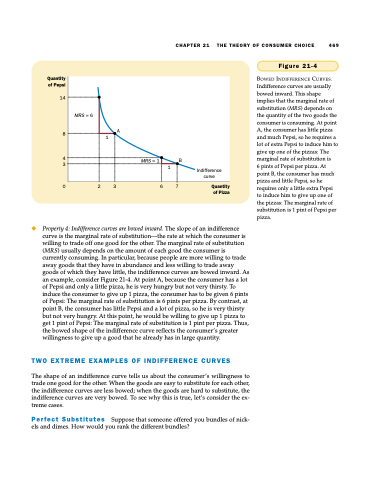
Indifference curves are usually bowed inward. This shape implies that the marginal rate of substitution (MRS) depends on the quantity of the two goods the consumer is consuming. At point A, the consumer has little pizza and much Pepsi, so he requires a lot of extra Pepsi to induce him to give up one of the pizzas: The marginal rate of substitution is
6 pints of Pepsi per pizza. At point B, the consumer has much pizza and little Pepsi, so he requires only a little extra Pepsi to induce him to give up one of the pizzas: The marginal rate of
N Property 4: Indifference curves are bowed inward. The slope of an indifference curve is the marginal rate of substitution—the rate at which the consumer is willing to trade off one good for the other. The marginal rate of substitution (MRS) usually depends on the amount of each good the consumer is currently consuming. In particular, because people are more willing to trade away goods that they have in abundance and less willing to trade away goods of which they have little, the indifference curves are bowed inward. As an example, consider Figure 21-4. At point A, because the consumer has a lot of Pepsi and only a little pizza, he is very hungry but not very thirsty. To induce the consumer to give up 1 pizza, the consumer has to be given 6 pints of Pepsi: The marginal rate of substitution is 6 pints per pizza. By contrast, at point B, the consumer has little Pepsi and a lot of pizza, so he is very thirsty but not very hungry. At this point, he would be willing to give up 1 pizza to get 1 pint of Pepsi: The marginal rate of substitution is 1 pint per pizza. Thus, the bowed shape of the indifference curve reflects the consumer’s greater willingness to give up a good that he already has in large quantity.
TWO EXTREME EXAMPLES OF INDIFFERENCE CURVES
The shape of an indifference curve tells us about the consumer’s willingness to trade one good for the other. When the goods are easy to substitute for each other, the indifference curves are less bowed; when the goods are hard to substitute, the indifference curves are very bowed. To see why this is true, let’s consider the ex- treme cases.
Perfect Substitutes Suppose that someone offered you bundles of nick- els and dimes. How would you rank the different bundles?
substitution is 1 pint of Pepsi per pizza.
